
Figure 4.
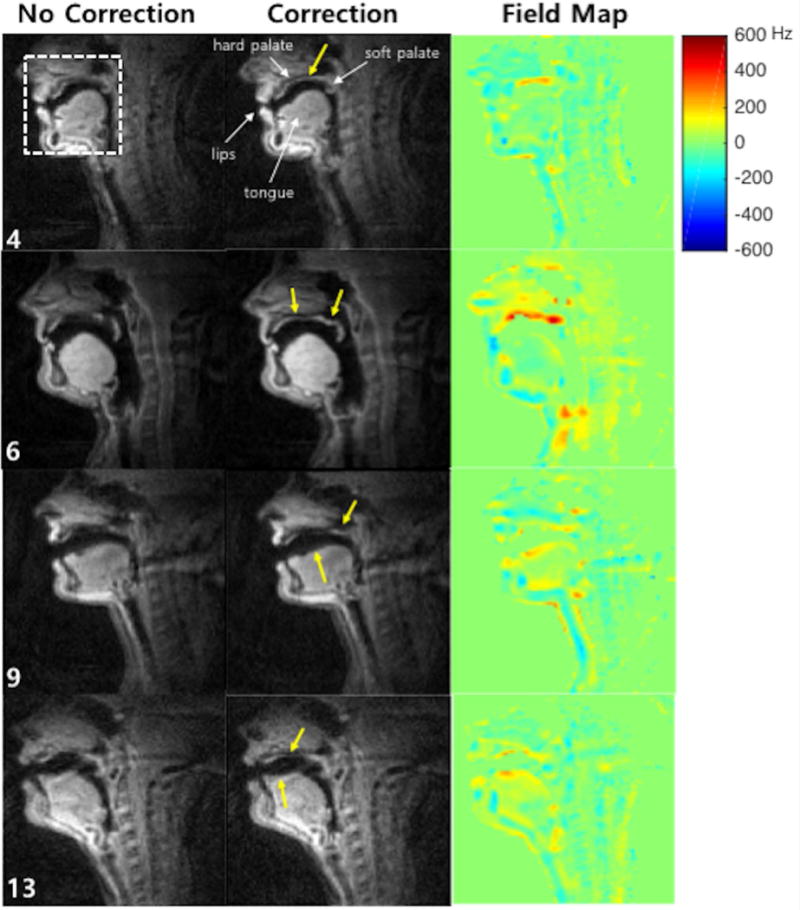
Representative mid-sagittal image frames of vocal tracts for four subjects, which, on visual assessment, presented the most significant blurring artifacts and were selected among the twenty subjects. The first and the second columns show images reconstructed with no correction and with correction, respectively. The last column shows the estimated field maps corresponding to those image time frames. Yellow arrows point out the regions that are most affected by off-resonance blurring, and corrected by the proposed method. (Video file is also available online as a supporting material.)