
Figure 6.
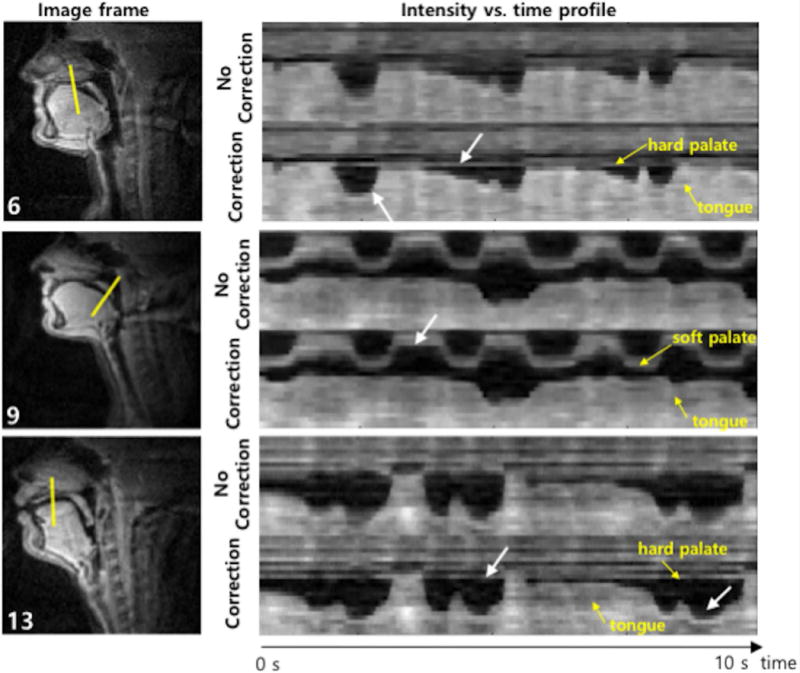
Illustration of improved sharpness of articulator boundaries. The first column shows an example frame for three different subjects and the second column shows intensity vs. time profiles marked by the solid lines in the first column images where each of the solid lines corresponds to one of the gridlines shown in Figure 3. For all subjects, the intensity time profiles from image sequences reconstructed with correction exhibit sharper boundary between tongue and air than that from image sequences with no correction. For Subject 9, the intensity profile from the correction provides a clear delineation of the soft palate movements. For Subjects 6 and 13, the correction method provides more constant intensity in the hard palate along time than image sequence with no correction.