
Figure 7.
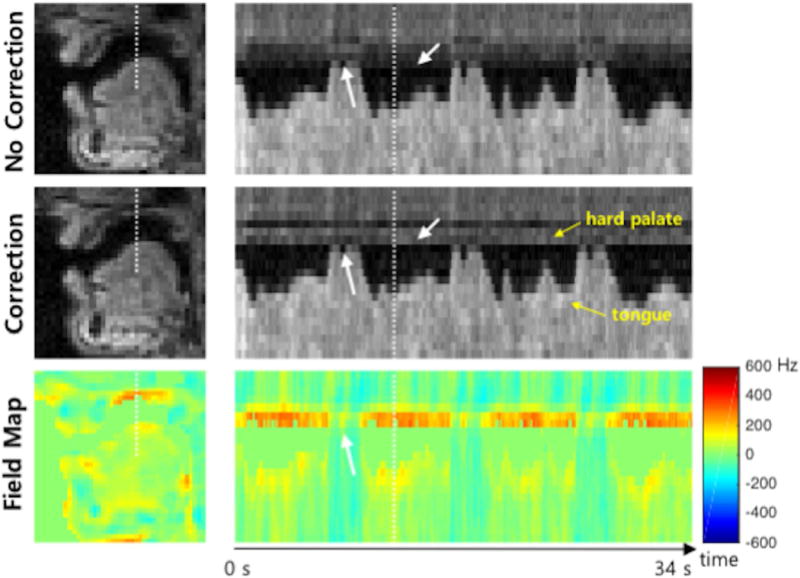
Illustration of the estimated field map over time. The first column shows example frames of reconstructed images and field map corresponding to the white dot box shown in Figure 4. The second column shows intensity vs. time profiles marked by the dot lines in the first column images. In the estimated field map, high off-resonance frequency values are shown at the hard palate (400 Hz) and tongue (200 Hz) boundaries over time except when the tongue contacts the hard palate. This is because when the tongue touches the hard palate, there is neither air and susceptibility difference between them. (Video file is available online as a supporting material.)