Figure 2.
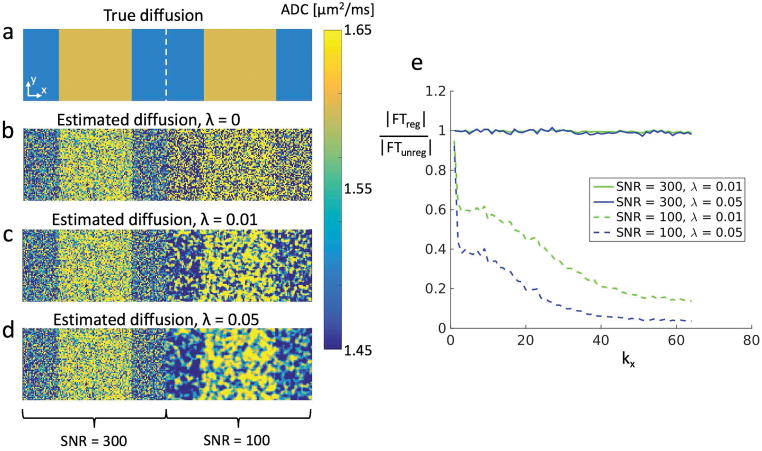
(a) A 256×64 matrix with T1=1.2s, T2=40ms, ADC1 = 1.5μm2/ms and ADC2 = 1.6μm2/ms. The S1L signal in the left half (128 pixels) has SNR=300 while in the right half this signal has SNR=100. (b) Without regularization, the underlying pattern is visible in the high-SNR half but very difficult to see in the low-SNR half (σ = 0.34/0.34 μm2/ms for ADC1/ADC2 giving an average of 0.34 μm2/ms). (c) Using Eq. 6 with λ=0.01, the structure of the ADC distribution starts becoming visible in the low-SNR half (σ = 0.15/0.14 μm2/ms for ADC1/ADC2 giving an average of 0.14 μm2/ms). Since the method reduces regularization in areas with high SNR, the left half of the image is almost unchanged. (d) Using Eq. 6 with λ=0.05 reveals the ADC distribution even more clearly, at the cost of smoothing of the sharp edges in the distribution (σ = 0.09/0.09 μm2/ms for ADC1/ADC2 giving an average of 0.09 μm2/ms). For b-d, the standard deviation of the high-SNR half was essentially the same (σ = 0.11/0.11 μm2/ms for ADC1/ADC2 giving an average of 0.11 μm2/ms). (e) The ratio of the magnitudes of the Fourier transforms with and without regularization (averaged over ky). Higher spatial frequency components are suppressed in the low-SNR region but remain in the high-SNR region. This is more pronounced with a larger regularization factor.

