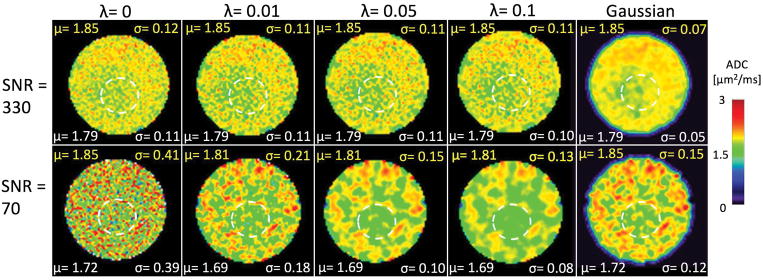
Figure 3.
ADC maps of a phantom from scans with high and low SNR, with (λ = 0.01, 0.05, 0.1) and without (λ = 0) regularization, and with regular Gaussian filtering with a filter standard deviation of σf = 1. The regularized maps with high SNR retain most of the pattern that is seen without regularization, but this is not the case for the Gaussian filtered map. The mean μ and standard deviation σ for the different smoothing approaches and SNR values are shown in each figure panel, with units of μm2/ms. The yellow labels refer to values across the whole phantom, while the white labels refer to values measured across a relatively uniform ROI within the phantom (dashed white circle).

