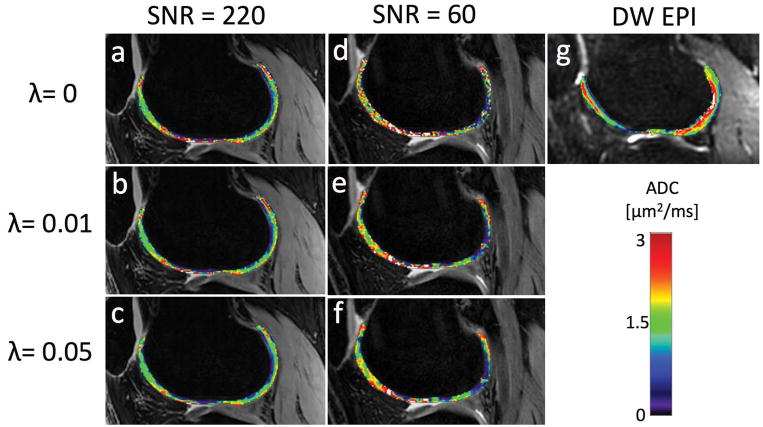
Figure 4.
(a) An unregularized DESS ADC map from a sagittal knee scan with high SNR. The mean ADC value was 1.40 μm2/ms with a 0.79 μm2/ms standard deviation. (b) The DESS ADC map from the same data but with a regularization factor of λ = 0.01. The map is not very affected by the regularization, with a mean of 1.34 μm2/ms and standard deviation of 0.73 μm2/ms. (c) The ADC map produced with λ = 0.05, with mean value of 1.29 μm2/ms and standard deviation of 0.66 μm2/ms. (d)–(f) The same maps but acquired with lower SNR. The mean/standard deviations are 1.67/1.05 μm2/ms, 1.56/0.90 μm2/ms, and 1.47/0.82 μm2/ms, respectively. Visually, the map is smoothed more than in the high-SNR case, especially between λ = 0 and λ = 0.01. (g) A reference DW EPI map, with mean 1.69 μm2/ms and standard deviation 0.77 μm2/ms.

