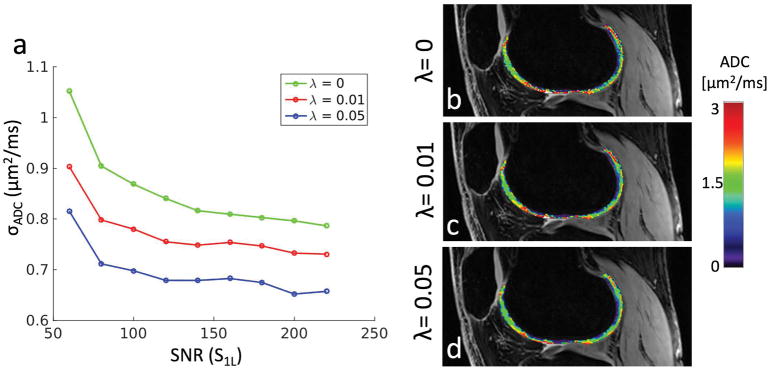
Figure 5.
(a) The standard deviation of the estimated ADC in cartilage as a function of the SNR of the S1L signal. The leftmost and rightmost points are the actual scan results shown in Fig. 4, while the points in between are simulated by adding noise to the higher-SNR scan. (b)–(d) A sample set of points from the curves in panel (a), corresponding to the center points (SNR=140). These can be compared to panels (a)–(f) in Fig. 4.

