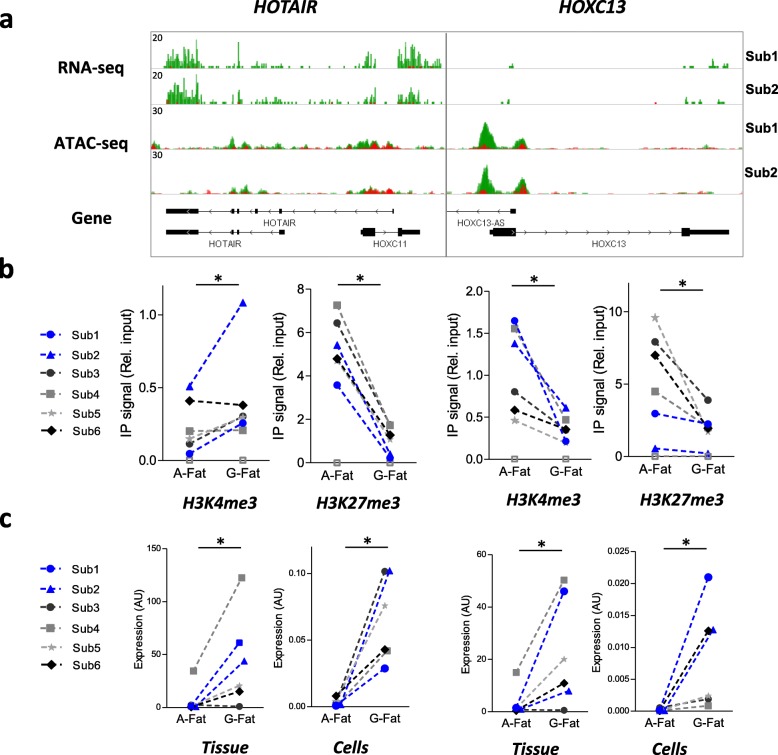
Fig. 6.
Validation of GF-specific gene expression and its correlation with active and repressive histone marks. a IGV genome browser view of RNA-seq and ATAC-seq signals on the indicated loci from abdominal (red) and GF (green) preadipocytes. Overlay tracks are presented for each gene loci. b ChIP-qPCR assay in abdominal and GF preadipocytes with H3K4me3 antibody and H3K27me3 antibody at the promoter region of the selected genes. c RT-qPCR assay for HOXC13 and HOTAIR in abdominal and GF preadipocytes. Wilcoxon test *p < 0.05. White squares represent the IgG negative control

