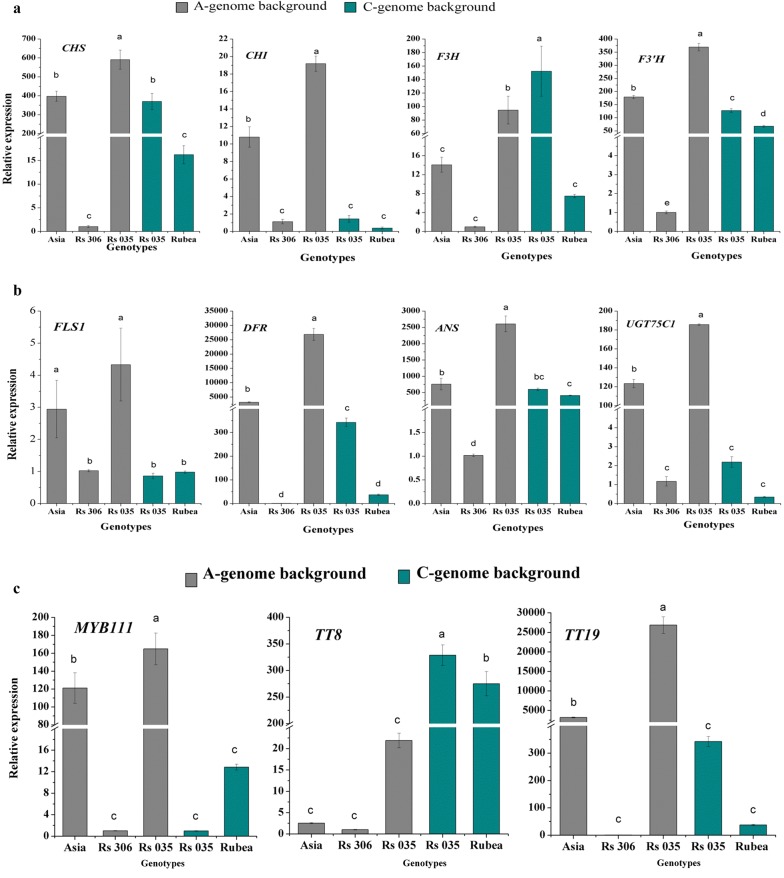
Fig. 4.
Expression patterns of the anthocyanin pathway genes. a Upstream structural and biosynthesis genes, b downstream biosynthesis genes, and c regulatory and transporter genes of the A and C genomes, determined using qRT-PCR with samples of the 4th leaf of 6-week-old plants of Asia (donor of A genome), Rubea (donor of C genome), and the resynthesized line Rs035 (red phenotype), with Rs306 (green phenotype) as a control. Error bars represent the standard deviation of the means of three independent replicates for each genotype, while different letters indicate significant differences among the genotypes at p < 0.01, following Tukey’s method

