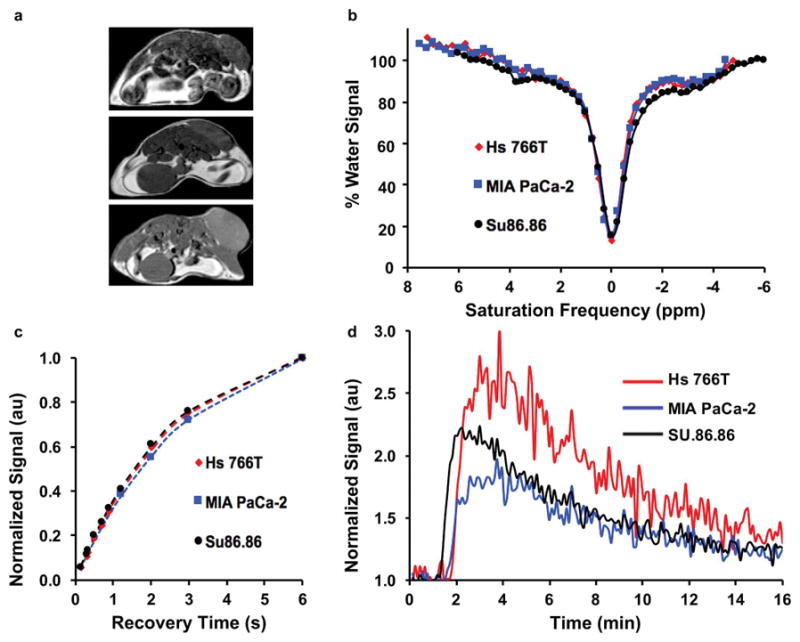
Figure 1.

Experimental work flow for in vivo mouse studies. (a) Examples of T2-weighted anatomical images of the Hs 766T (top), MIA PaCa-2 (middle), and SU.86.86 (bottom) tumor models. (b) Examples of CEST spectra for the three tumor models. (c) Examples of T1-weighted recovery time curves for the three tumor models. (d) Examples of DCE CNR evolutions for the three tumor models.
