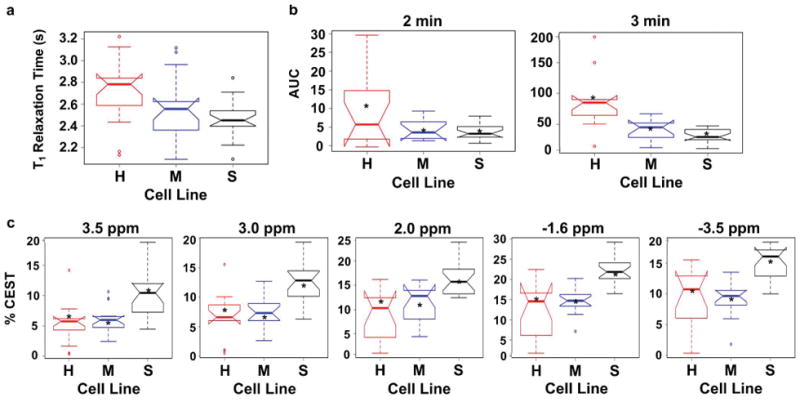
Figure 2.

Distributions of MRI results in notched boxplot representations. H = Hs 766T tumor model; M = MIA PaCa-2 tumor model; S = SU.86.86 tumor model. (a) The distributions of T1 relaxation times for H, M, and S tumor models. The Area under the Curve (AUC) from injection to 2 minutes (left), and from injection to 3 minutes (right), for H, M, and S tumor models. (c) The distributions of % CEST signals at saturation frequencies of 3.5, 3.0, 2.0, −1.6, and −3.5 ppm for H, M, and S tumor models.
