
Figure 6. Fecal Microbiome Diversity Directly Correlates with Regulatory T Cell Proportions.
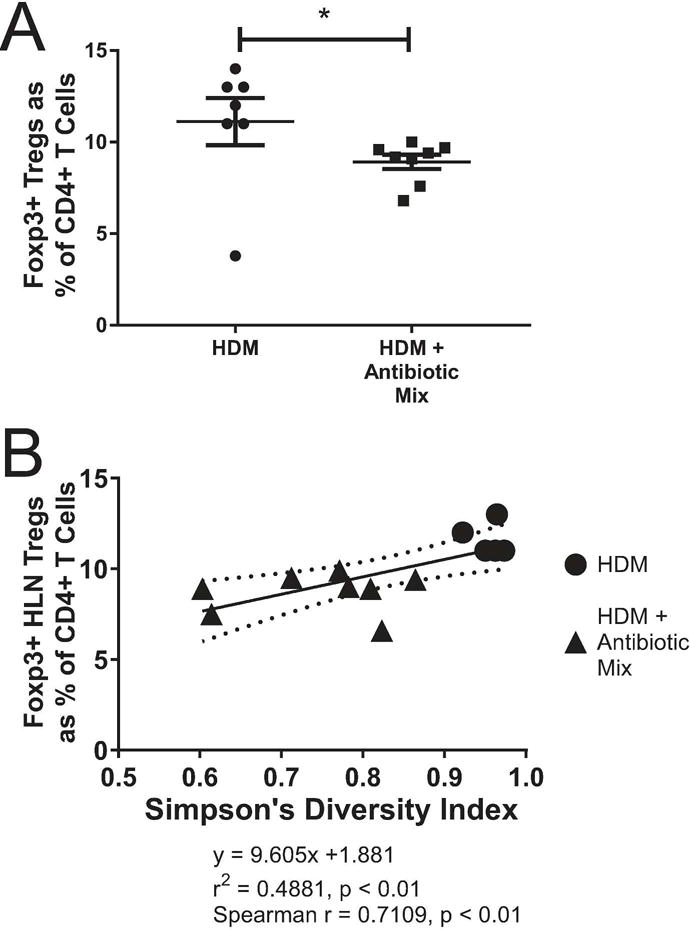
At sacrifice, Lung-Draining (Hilar, Mediastinal) Lymph Nodes (HLNs) were removed and processed to identify CD3+CD4+Foxp3+ regulatory T cells (Tregs) (A). Simpson’s Diversity Index was plotted against the proportion of all CD4+ T Cells in the HLN that are Foxp3+ Tregs (B). The Spearman r coefficient of correlation was calculated. The solid line is the linear regression line with the equation shown below the graph. The curved, dotted lines represent the 95% confidence band for the linear regression line. Error bars represent mean ± SEM. For (A), n=7 for HDM and n=8 HDM + Antibiotic Mix. For (B), n=5 for HDM and n=8 for HDM + Antibiotic Mix. Not all animals from (A) were able to be assessed for (B) due to poor DNA extraction and/or 16S gene amplification. * p < 0.05.