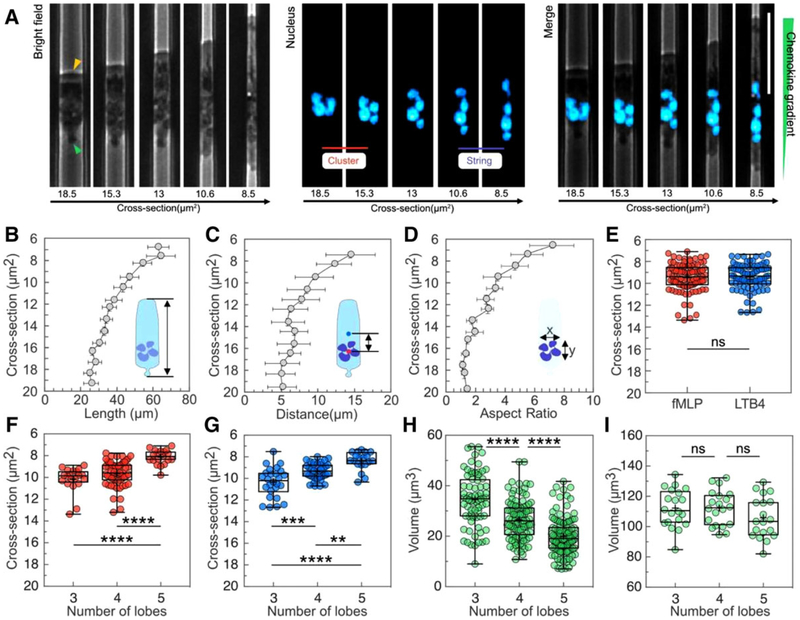
FIGURE 2. Morphological changes and rearrangement of the nucleus lobes in neutrophils during chemotaxis in tapered channels.
(A) Phase contrast, fluorescence and overlap of images showing cellular and Nuclear morphology changes during the migration of one typical neutrophil in a channel with cross-section decreasing from ~19 to ~8 μm2. The nucleus of neutrophils was stained with Hoechst and pseudo-colored cyan. The scale bar is 30 μm. The yellow arrow indicates the leading edge. The green arrow indicates the uropod. (B) Cell length increases as the cross-section of the channels decreases (n = 15). (C) The distance between the center of the nucleus and the center of the cell over cross-section. (D) The nuclear aspect ratio x/y over cross-section. (E) The critical cross-sections at which the cluster-string transformation of nuclear lobes occur in gradients of 100 nM fMLP or LTB4. The cross-sections at which the cluster-string transformation happens for neutrophils with 3, 4, and 5 lobes in gradients of (F) 100 nM fMLP and (G) LTB4 (**P < 0.01, ***P < 0.001, and ****P < 0.0001, one-way ANOVA). (H) The estimated volume of individual lobes of neutrophils with 3, 4, and 5 lobes (****P < 0.0001, one-way ANOVA). (I) The total nuclear volume of neutrophils with 3, 4, and 5 lobes

