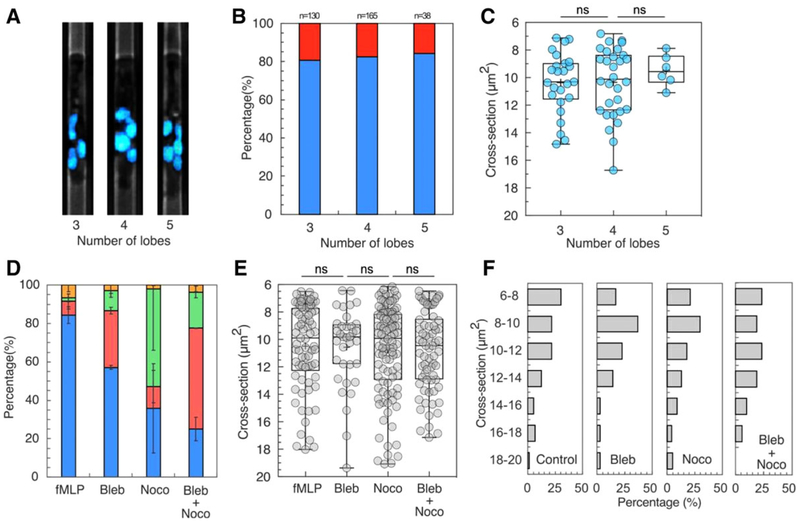
FIGURE 3. Cellular structures contribute to migration patterns during neutrophil chemotaxis.
(A) Fluorescent microscopic images showing neutrophils with 3, 4, and 5 nuclear lobes. The nucleus is stained with Hoechst and pseudo-colored cyan. (B) The percentage of persistent migration (blue bar) and non-persistent migration (red bar) of neutrophils with 3, 4, and 5 nuclear lobes. (C) Cross-sections at which neutrophils with 3–5 lobes exhibited A, O, and R patterns. (D) The percentage of migration patterns for control and neutrophils treated with acto-myosin inhibitor (blebbistatin), microtubule inhibitor (nocodazole), and both inhibitors in fMLP gradient (percentages of P, A, O, R patterns are presented in blue, red, green, and yellow, respectively). (E) The critical cross-sections at which A, O, and R patterns occurred for control and neutrophils treated with blebbistatin, nocodazole, and both inhibitors. (F) Histograms of the critical cross-sections for control, blebbistatin, nocodazole, and combined inhibitor-treated neutrophils

