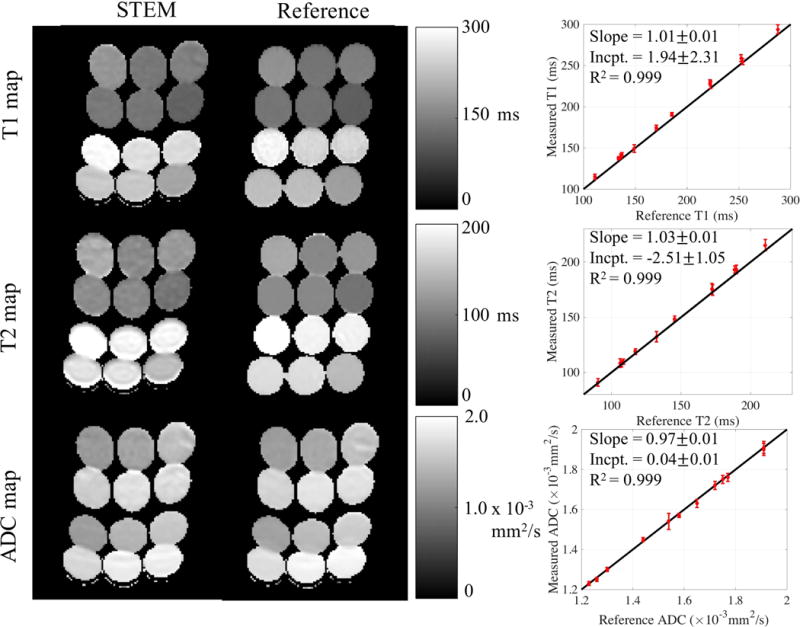
Figure 2.

T1, T2 and ADC maps estimated from STEM are accurate compared to the reference maps. The vials in the parametric maps have EPI distortion artifacts in the STEM images and the reference spin echo ADC map because of the EPI acquisitions. ROI measurements for each vial from STEM agree with the co-localized ROI results from the reference maps. The black lines in the plots to the right are the identity lines representing equal measurements and references.
