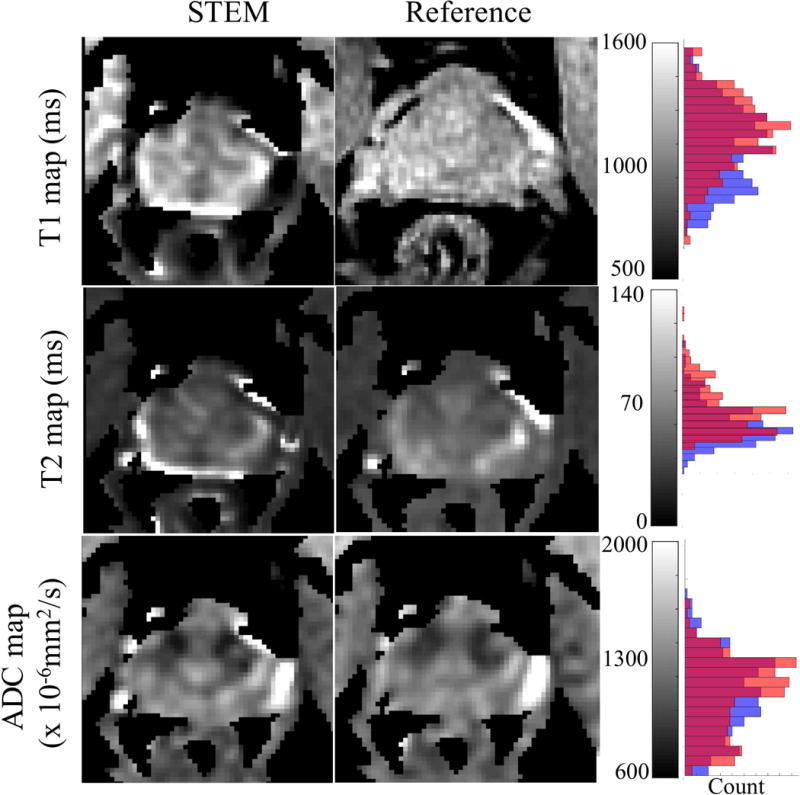
Figure 4.

The distributions of T1, T2 and ADC measurements in the prostate from STEM agree with the references, though with some bias in the T1 and T2 maps. Artifacts appearing at the edge of the prostate are mainly from the inter-acquisition motion from series to series. The histograms to the right show the overall accuracy of each measurement covering only the prostate area. Orange bars in the histograms are from the reference maps, blue bars are measurements from STEM and the red color represents the overlapping area of orange and blue bars.
