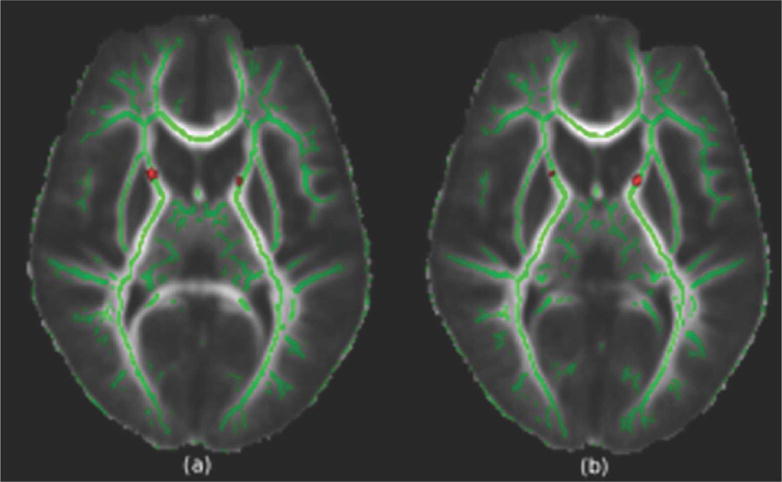
Figure 2.

Regions displaying a significant decrease in fractional anisotropy in the tract based spatial statistics analysis (t>3, p=0.05) superimposed on the mean FA image. Green denotes the white matter FA skeleton. Compared to controls, the chronic kidney disease group showed decreases in the right and left anterior limb of the internal capsule.
