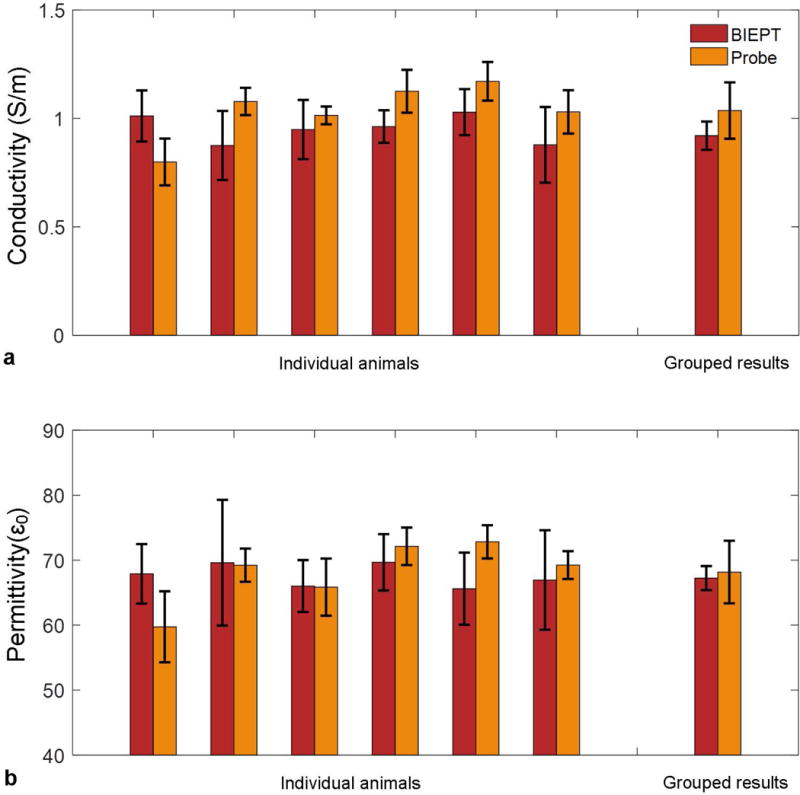
FIG. 6.

In vivo imaging and ex vivo probe measurement results from the animal experiments for conductivity (a) and permittivity (b). Individual imaging results are shown as mean ± standard deviation of tumor pixels in the central three axial slices. Individual probe measurement results are shown as mean ± standard deviation of four measurement trials on the central cut of tumor. Grouped imaging results are shown as mean ± standard deviation of 11 animals. Grouped probe measurement results are shown as mean ± standard deviation of 6 animals.
