
FIG. 7.
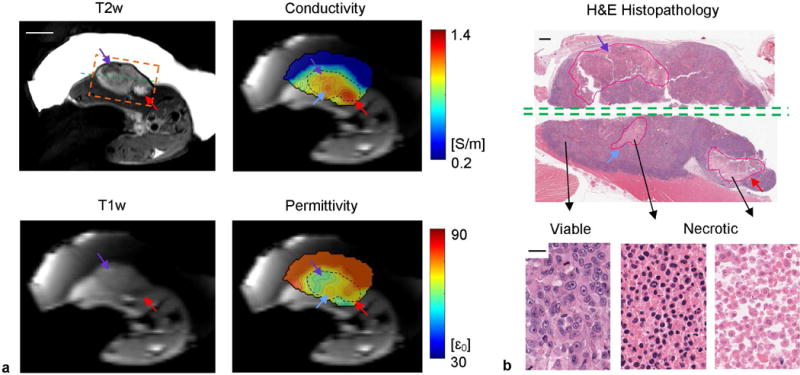
In vivo EP imaging of rat #1. (a) T1w, T2w, conductivity and permittivity maps. The black dashed contours on EP maps contour the tumor based on the T2w image. The orange dashed box shows the field of view of the histological slide in (b). The green dashed line shows the position where the tumor was cut through for probe measurement. Scale bar: 10 mm. (b) H&E histopathology of the same imaging slice in the orange dashed box as in (a). The necrotic cores were contoured by an experienced pathologist (E.R.). Examples of viable, necrotic, and highly necrotic tumor tissues are shown with distinct nuclear and cellular shape and density. Scale bars: 1 mm on whole-mount pathology and 20 on zoomed pathology.