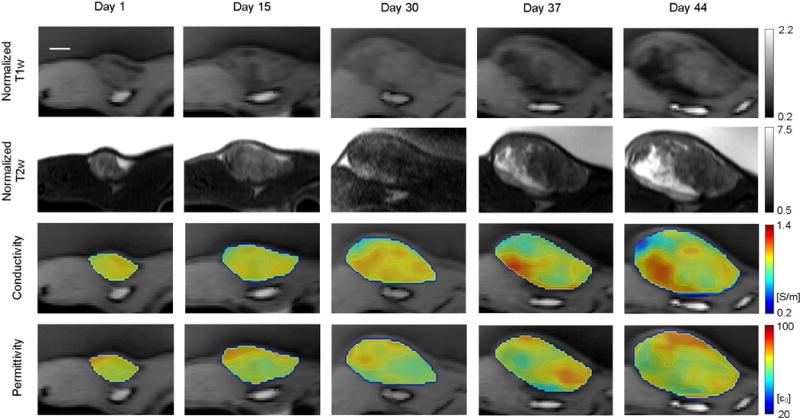
FIG. 9.

Longitudinal monitoring of a malignant human breast tumor in rat. MRI performed at five checkpoints as labeled on top of the images. From top to bottom: Normalized (to muscle) T1w images, normalized T2w images, quantitative conductivity and permittivity of tumor in color map overlaid on the T1w image. The animal was positioned similarly for all scans, and the axial slice with the largest tumor cross-section is shown in this figure. Images of the same contrast share the same colorbar. All images share the same scale bar shown on the top left, which is 5 mm.
