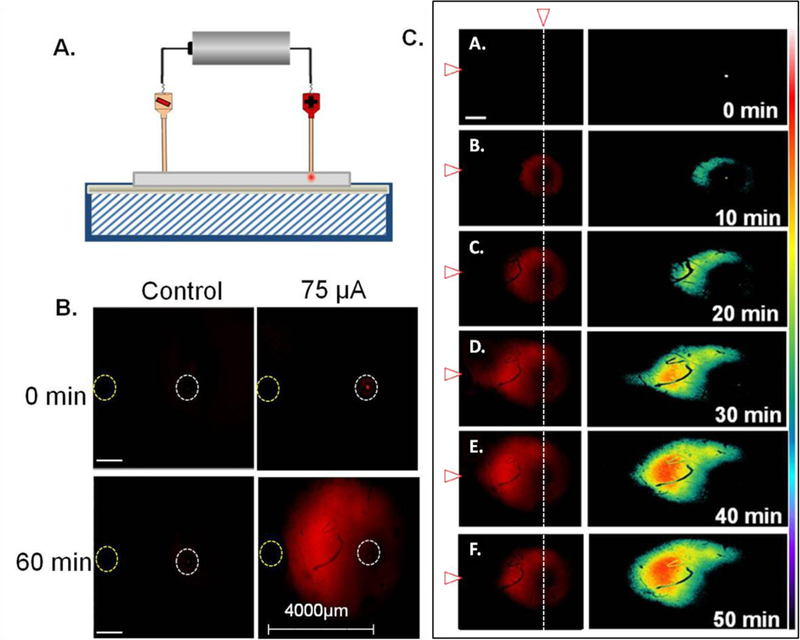
Figure 1.

Example of an electrokinetic infusion of Ru(bpy)32+ in a hydrogel with a ζ-potential similar to rat OHSCs with 75 μA applied current for 60 minutes. (A) Experimental set-up. (B) Fluorescence in a hydrogel with an applied current of 75 μA. Left images are the control gel with no applied current and right images are after an applied current. (C) Infusion profiles were obtained at varying time points in a hydrogel, with an applied current of 75 μA. Top panel is at time 0 and bottom panel is at time 50 minutes. Scale bar in C is 100 μm. Corresponding surface intensity (right column) plots were also examined with fluorescence images as shown in C. The color bar to the right represents relative intensity with white (255) and black (0). White vertical dotted line shows the position of dye and infusion capillary and white/red arrow represents the position of the counter capillary/electrode (left). An Olympus objective lens of 1.25× with a numerical aperture of 0.04 was used for imaging.
