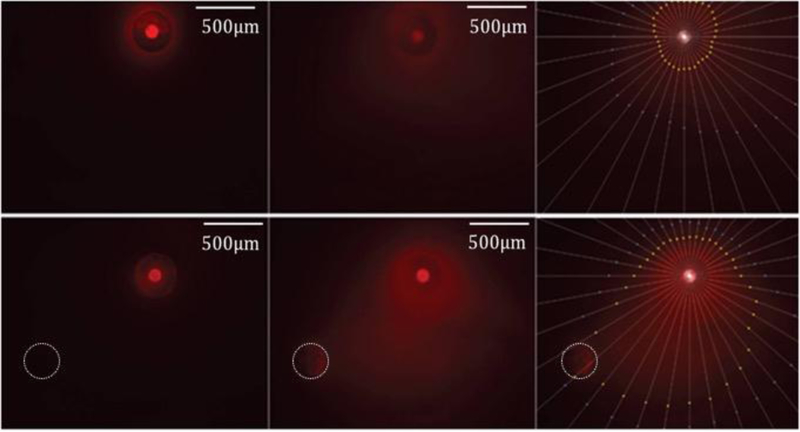
Figure 2.

Delivery of Ru(bpy)32+ in OHSCs at 1.5μA current. Left column is at initial timepoint; Center column is after 25 minutes; Right column is after 25 minutes with points showing 25% (yellow) and 15% (blue) of the maximum intensity at the infusion capillary. Top row: counter electrode in the GF-HBSS bath below the tissue. Bottom row: counter electrode at lower left in tissue, denoted with white outline. The scale bar is 500 μm.
