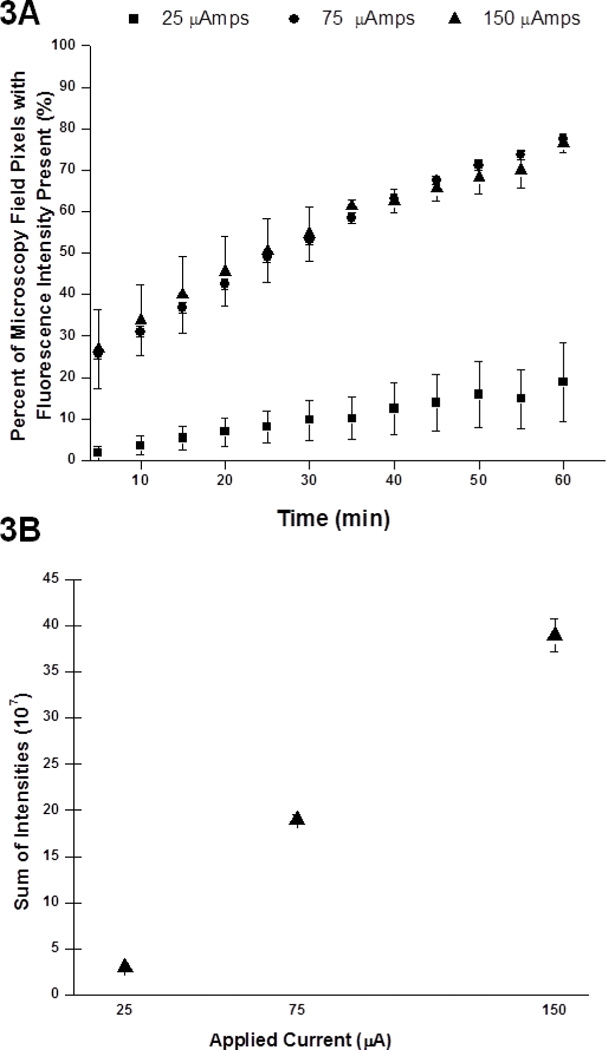
Figure 3.

Electrokinetic transport of Ru(bpy)32+ in a hydrogel model of brain tissue using 3 different currents: 25 μA, 75 μA and 150 μA for 1 hour (N = 3 each). (A) Percentage of pixels in viewing area at a magnification of 1.25x demonstrating fluorescence intensity above background. Significant difference exists between 25 μA and 75 μA and between 25 μA and 150 μA. One-way ANOVA: F (2,33) = 41.36, p = 0.000001; and Tukey post-hoc test: p<0.05. (B) Aggregate sum of fluorescence intensity above background within viewing area at a magnification of 1.25× with numerical aperture 0.04. Significant differences exist between the three currents with error bars representing standard error of the mean (SEM).
