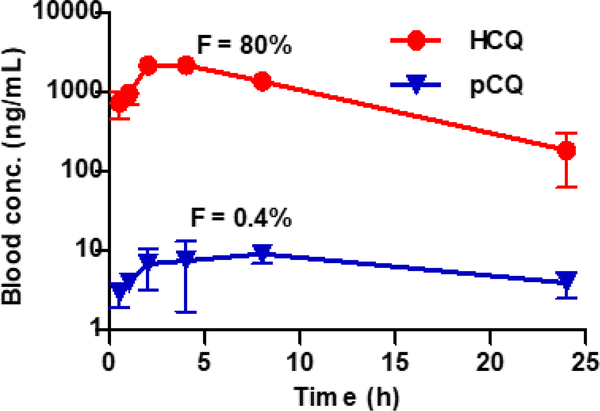
Figure 3. Blood concentration vs. time profile.
Mice subjected to the C. rodentium colitis were orally administered with HCQ or pCQ (30 mg/kg HCQ equivalent). Results are shown as HCQ blood concentration ± SD (n=3). Data shown represent the total (polymer-bound + free) HCQ blood concentration in the pCQ treatment.

