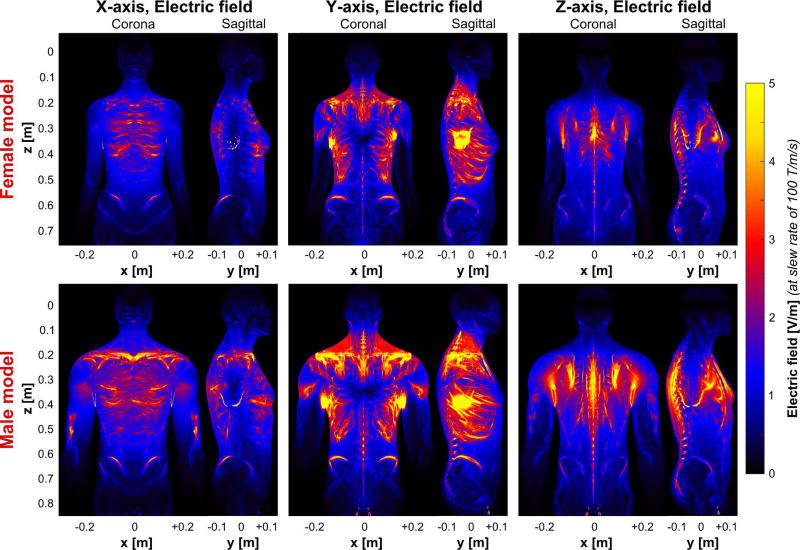
Figure 3.
Electric field maps (maximum intensity projection) induced by the BG1 coil in the female (top) and the male body models (bottom). The coil driving waveform is scaled so as to achieve a slew rate of 100 T/m/s (note that the electric field varies with dB/dt and not with B). For better visibility, the electric field in bone is set to zero (the electric field in the bones is usually very high and would dominate the color scale otherwise).

