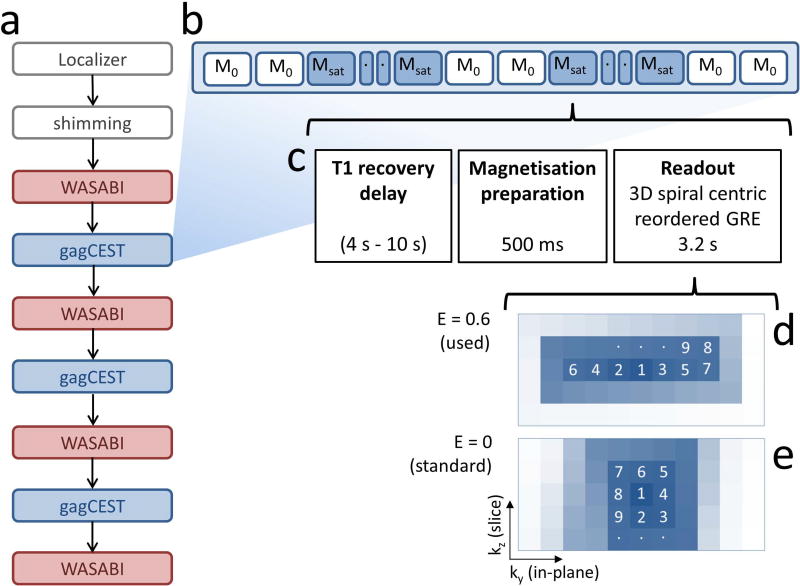
Figure 1.
Flowchart of the measurements for investigating the impact of frequency drift on gagCEST (a) with schematic view of the order of M0 and Msat acquisitions during the 3D gagCEST sequence (b), consisting of T1 recovery block, magnetization preparation block, and readout block (c). The 3D centric rectangular spiral GRE sequence (d) reduces in-plane blurring in comparison to the standard spiral readout (e), due to an elongation E = 0.6 of the spiral in the in-plane phase encoding direction ky. The numbers in this schematic image indicate the order of k-space line acquisitions.

