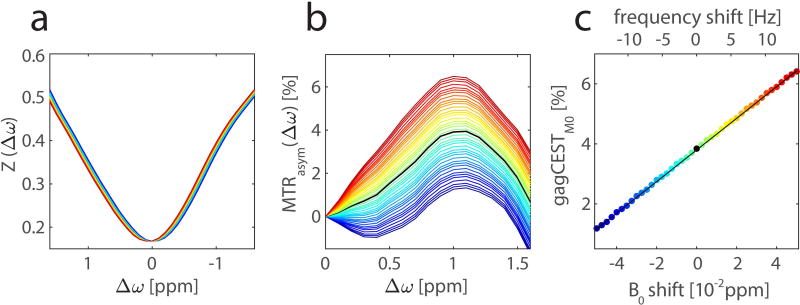
Figure 2.
Influence of a B0 shift on gagCEST data. Smoothed Z-spectra from an ROI in the femoral cartilage of a 32-year-old healthy volunteer at 7T with B0 shifts of −0.05 to 0.05 ppm, frequency shift from −14.85 Hz to 14.85 Hz, respectively, are plotted from blue to red (a). Corresponding MTRasym curves (b) show a strong dispersion upon the B0 shift. In the considered range, the gagCEST contrast depends linearly on the B0 shift with a slope of 0.53%/0.01 ppm (0.18%/Hz) (c). The corresponding linear fit of the gagCESTM0 values is illustrated with a black line.

