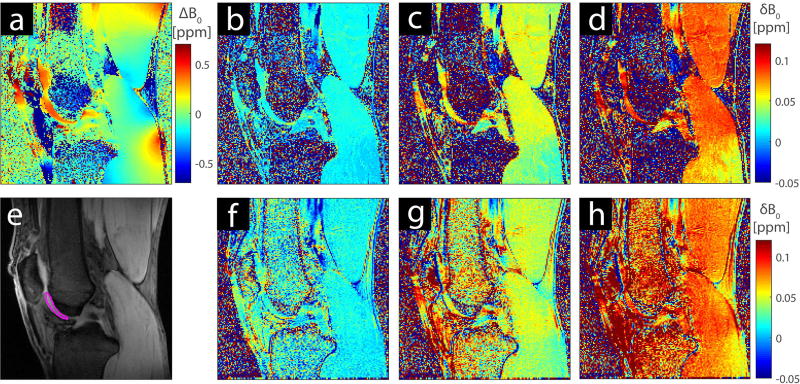
Figure 3.
B0 map of the left knee of a 32-year-old healthy volunteer at 7T from the first WASABI acquisition (a) and M0 image of the same slice with ROI (e). Interpolated WASABI B0 maps showing the B0 shift δB0 at t = 6 min (b), t = 18 min (c), and t = 30 min (d) relative to the first B0 map (a) at t=0. The δB0 maps obtained using the GRE phase images at t = 6 min (f), t = 18 min (g), and t = 30 min (h) are smooth and show the similar local variations.

