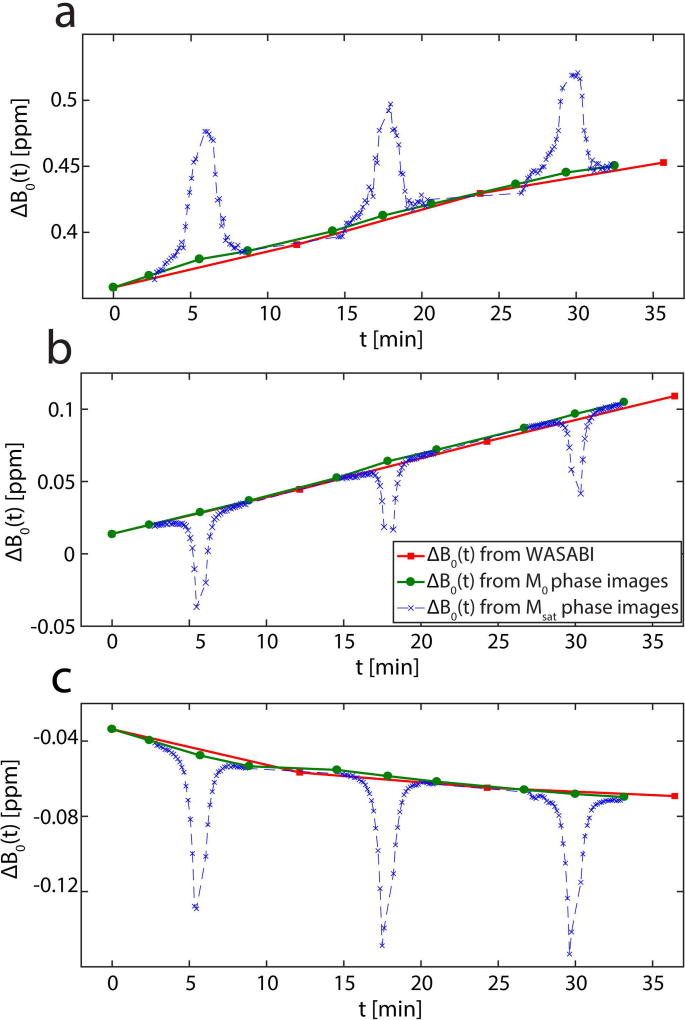
Figure 4.
ROI averaged ΔB0 as a function of measurement time t in the femoral cartilage of a 32-year-old healthy volunteer (a) and in a glucose phantom after an idle period of the MRI scanner (b) and after a gradient intensive fMRI study (c) acquired at 7T. Data points are calculated using WASABI acquisitions (red squares) phase images of M0 images (green circles) and phase images of Msat images (blue crosses). The ΔB0 from WASABI and M0 phase images are in good agreement, whereas the ΔB0 of the Msat phase images clearly depends on the CEST saturation offset.

