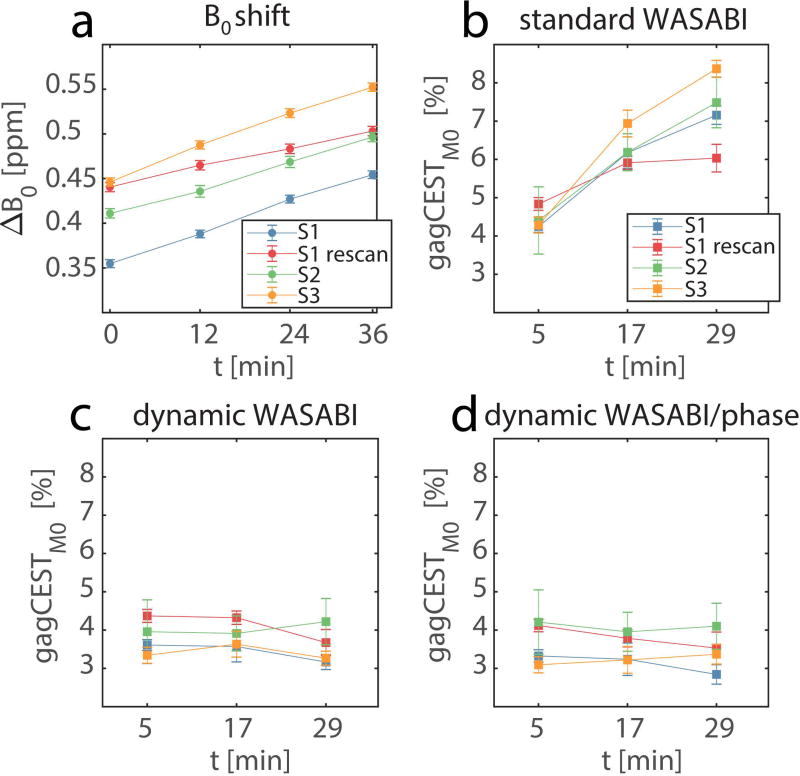
Figure 7.
B0 drift (a) and gagCESTM0 values (b-d) averaged over ROIs in the femoral cartilage in all subjects (S1-S3) for different correction methods. Each subject is plotted separately as a function of measurement time t. Data corrected with standard B0 correction (b) shows a strong increase and a larger dispersion of values over time. Data corrected with the dynamic WASABI (c) or the dynamic combined WASABI/phase approach (d) show good stability over time. Error bars represent the standard deviation of the mean.

