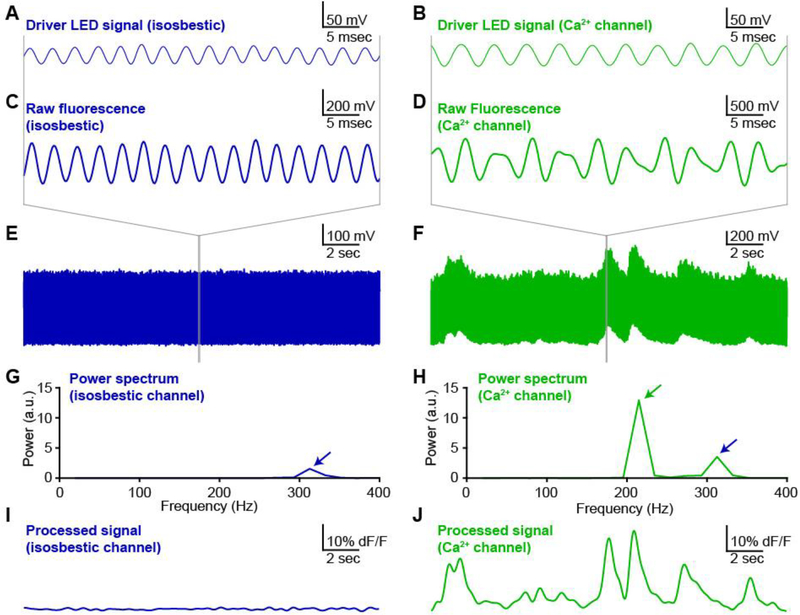
Figure 3. Oscillating excitation light minimizes background fluorescence and channel cross-talk.
Exemplar photometry recording and analysis from dorsomedial striatum of an A2Acre mouse expressing GCaMP6m in medium spiny neurons (MSNs) of the indirect pathway. A,B, Oscillating driver signals for isosbestic channel (Panel A, 405 nm; oscillating at 319 Hz) and calcium-sensitive channel (Panel B, 465 nm; oscillating at 217 Hz). C,D, Fluorescence signal from isosbestic channel (Panel C) and calcium-sensitive channel (Panel D) at expanded time scale to show phase-locked oscillations in fluorescence emission relative to each LED driver signal (panels A,B above). E,F, Fluorescence measurements for each channel at long time scale to show stability of isosbestic channel (Panel E) relative to calcium-sensitive fluctuations in fluorescence (Panel F). G,H, Power spectra calculated from a discrete 50 ms window of each fluorescence emission signal. Blue arrows indicate the peak corresponding to the isosbestic channel (405 nm excitation light; oscillation at 319 Hz). Green arrow indicates peak corresponding to calcium-dependent channel (465 nm excitation light; oscillation at 217 Hz). I,J, Fluorescence signal for each channel calculated by post-hoc processing over a sliding window (see methods).

