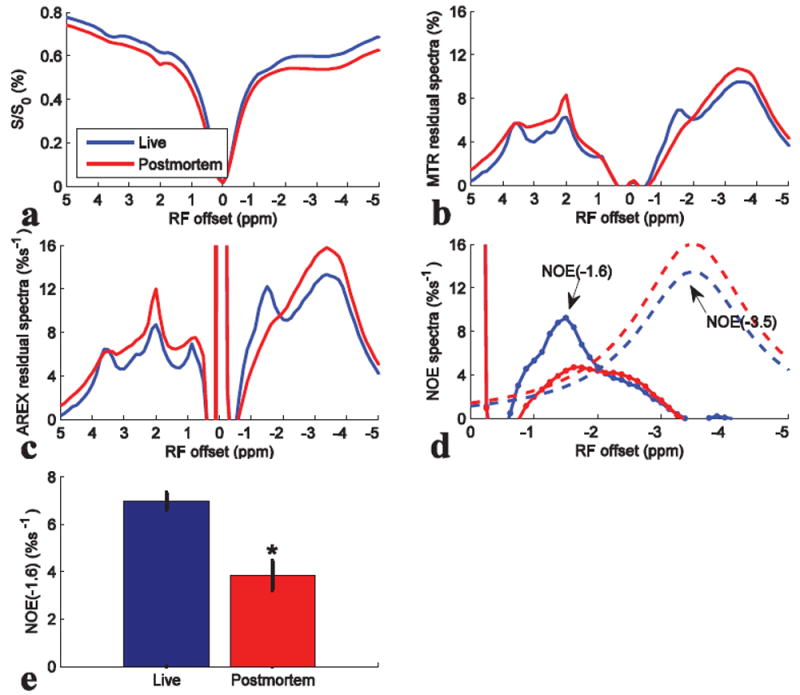
Fig. 7.

Z-spectra (a), MTR residual spectra (b), AREX residual spectra (c), fitted NOE(-3.5) spectra (dashed line) and remaining NOE(-1.6) spectra (dotted line) (d), and the statistics of NOE(-1.6) (e) from live and postmortem rats. CEST data were average of four rat brains. ROI was drawn from the whole rat brain of slice #2. *P < 0.05.
