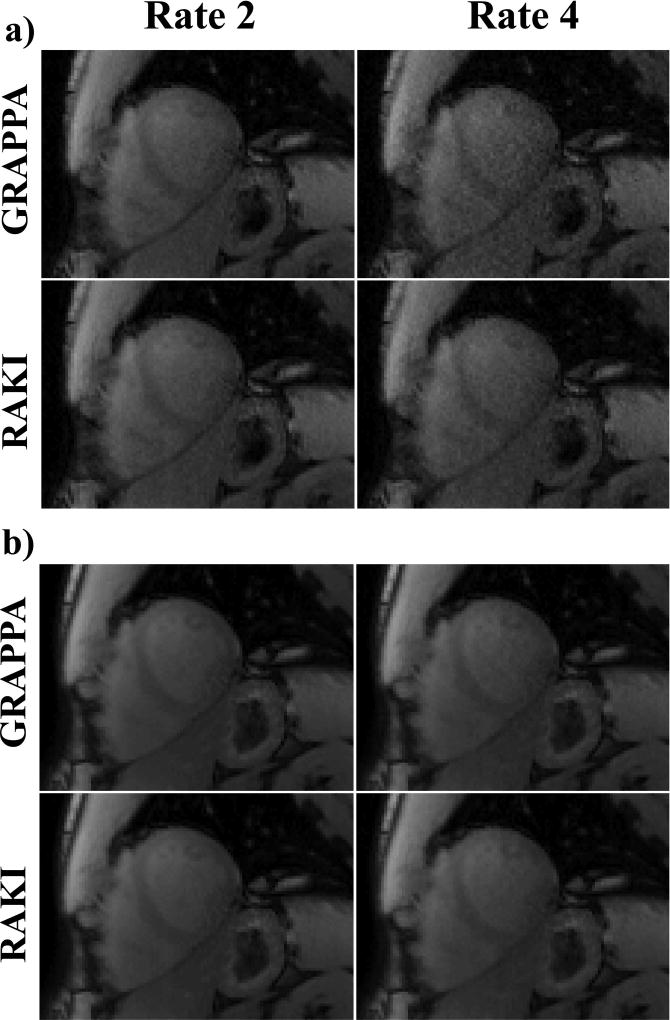
Figure 4.
Representative T1-weighted images from SAPPHIRE T1 mapping acquired at the conventional resolution of 1.7×1.7 mm2. (a) Images with low acquisition SNR, corresponding to the shortest inversion time, at the acquisition acceleration rate of 2, and a retrospective acceleration rate of 4. At rate 4, the noise performance improvement of RAKI over GRAPPA becomes apparent. (b) Images with high acquisition SNR, where the differences between RAKI and GRAPPA are visually minor even at the acceleration rate of 4, with a slight improvement in the left ventricle blood pool for RAKI. A quantitative analysis of the resulting T1 maps indicate that comparable quantification is observed for the two reconstructions, except for a 10% reduced noise variability with RAKI at rate 4.

