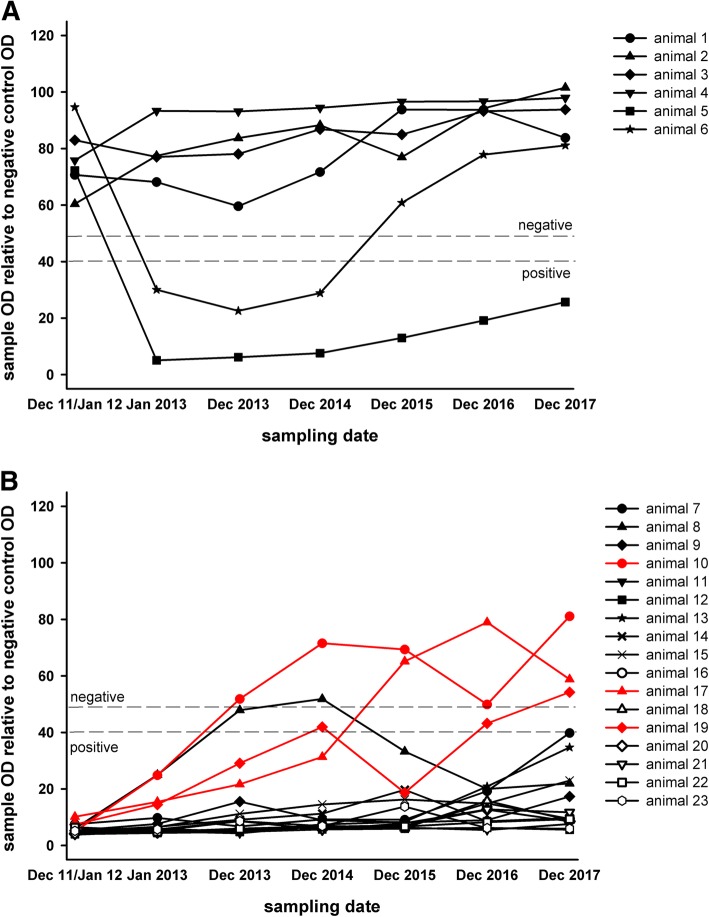
Fig. 2.
SBV antibody ELISA results of all animals that were consistently sampled once per year between December 2011/January 2012 and December 2017. In figure panel A animals negative at the first sampling time point are shown, while in figure panel B animals that were seropositive at the first sampling are depicted. Animals that tested positive in December 2011/January 2012, but seronegative in December 2017 are marked in red

