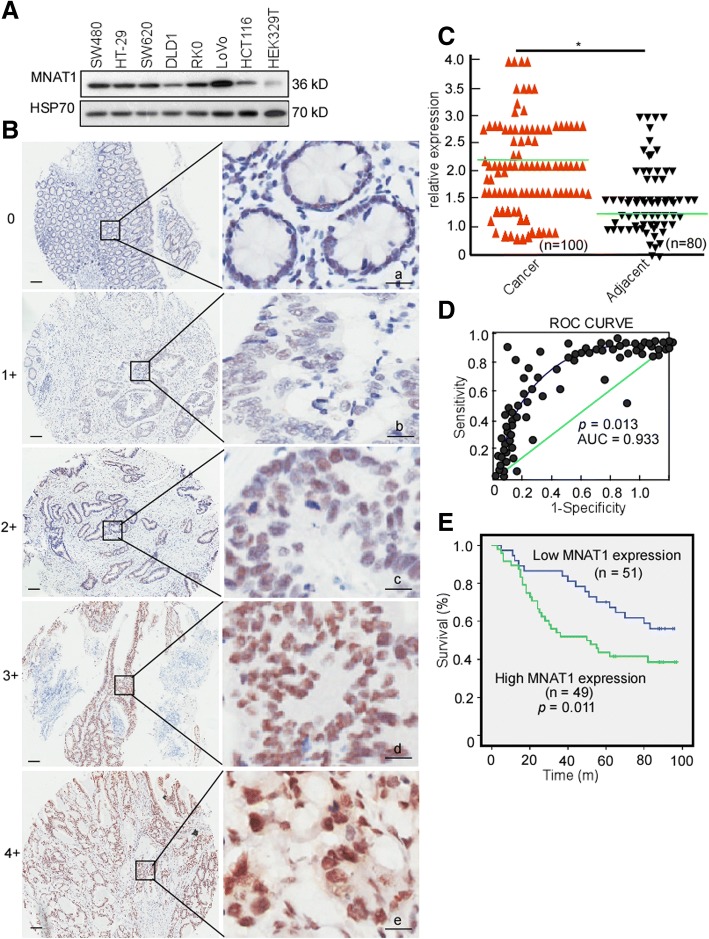
Fig. 1.
MNAT1 expressions in CRC and its association with CRC patient outcomes. A, MNAT1 expressions were detected in SW480, HT-29, SW620, DLD1, RK0, LoVo, HCT116, and HEK329T using Western-blotting. B, MNAT1 expressions in CRC and non-tumor tissues microarray were detected using immunohistochemstry (IHC). a, negative, scored as 0; b, weakly positive, scored as 1; c, moderately positive, scored as 2; d, positive, scored as 3; e, positive, scored as 4; Scale Bar, 100 μm. C, MNAT1 expression levels in CRC tissue samples were quantified using a German semiquantitative scoring system. Relative expressions in CRC tissues and non-tumor tissues were statistically analyzed using Mann-Whitney U test. The dots represent scores. D, The cut-off value of MNAT1 immunoreactive score is 4.6 according to the ROC curve, and the AUC is 0.933. ROC, receiver operating characteristic; AUC, area under the curve. E, The overall survival of CRC patients with high (49) or low (51) MNAT1 expression. *, p < 0.05

