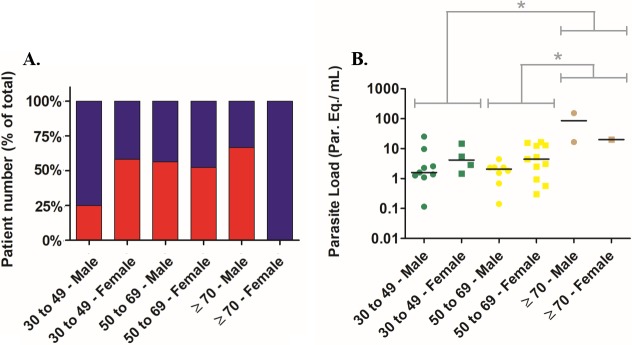
Fig 2. Clinical manifestations and parasite load in chronic patients grouped by age and gender.
In A, clinical manifestations grouped by patients age and gender. Red bars: patients with cardiac form (CCC). Blue bars: patients with indeterminate form. In B, parasite load in blood of patients grouped by age and gender: Green symbols: from 30 to 49 years old; Yellow symbols: from 50 to 69 years; Brown symbols: over 70 years old. (●) Male patients, (■) Female patients. The horizontal lines represent the parasite load median values. *P<0.05 (Mann-Whitney Rank Sum test).

