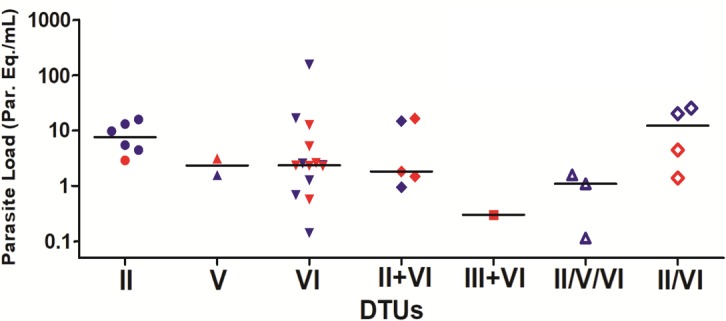
Fig 7. Comparison between T. cruzi genotype, clinical form and parasite load.

The symbols represent the parasite load for each patient, distributed by T. cruzi DTUs. The horizontal lines correspond to the median values of parasite load in each DTU. Red symbols indicate patients with CCC and blue symbols indicate patients with the indeterminate form.
