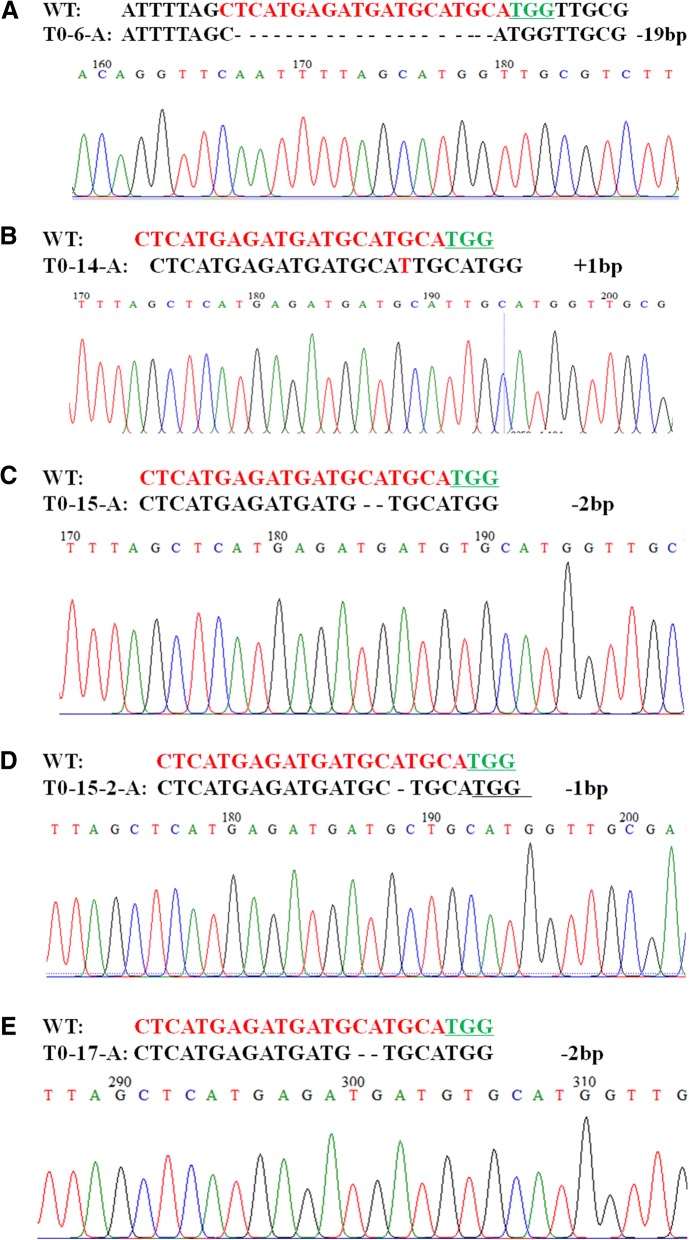
Fig. 4.
Detailed sequence analysis of CRISPR/Cas9-induced DA1 gene mutations in the T0 generation. a-e Targeted mutagenesis in the A genomes of selected T0 plants with site-specific mutations accompanied by the corresponding regions of the sequencing chromatograms. The nucleotides of the target site are in red. Green underlined nucleotides indicate the PAM sequences of the sgRNA. “-” and “+” indicate the deletion and insertion of the indicated numbers of nucleotides, respectively

