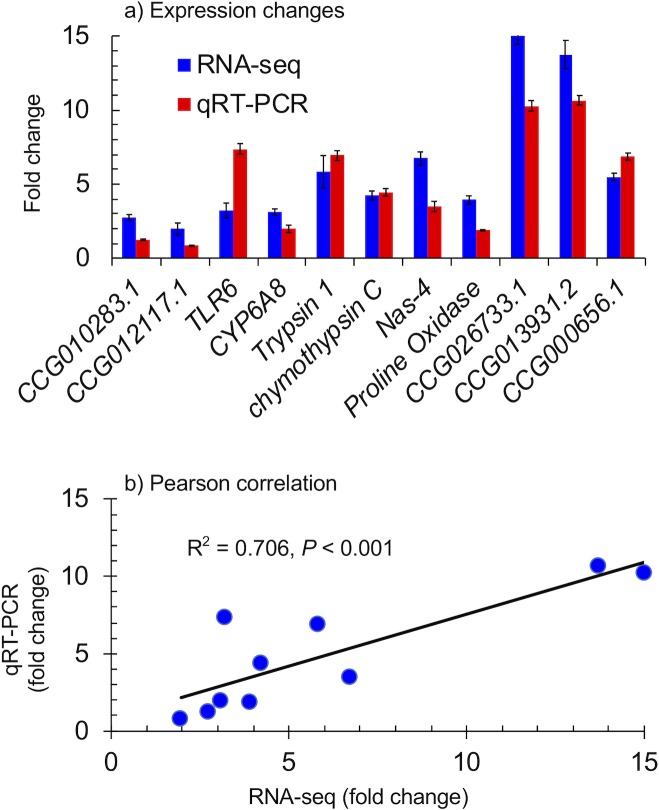
Fig 2. Comparison of expression value measured by RNA-seq and qRT-PCR.
A) Fold change of expression value in the resistant individuals relative to the susceptible individuals, as measured by RNA-seq and qRT-PCR in 11 selected genes. B) Pearson correlation between fold changes in gene expression between resistant and susceptible mosquitoes, as determined by qRT-PCR and RNA-seq (P<0.05).

