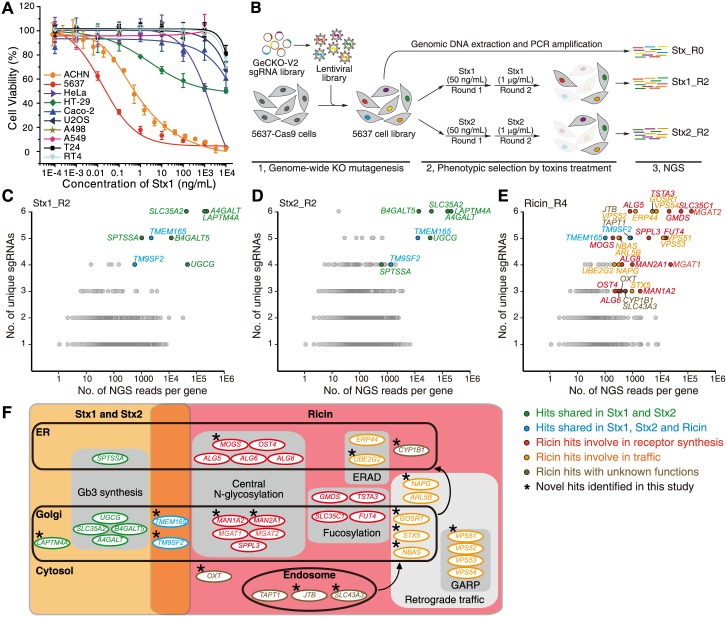
Fig 1. Genome-wide loss-of-function CRISPR-Cas9 screens to identify host factors for Stx1, Stx2, and ricin.
(A) A range of human cell lines were exposed to a series of concentrations of Stx1 for 72 h and cell viability was measured using MTT assays. The toxin concentrations that resulted in the death of 50% of cells are defined as IC50 and listed in S1 Table. The bladder cancer cell line 5637 was the most sensitive one to Stx1, followed by the kidney cancer cell line ACHN. Error bars indicate mean ± SD, N = 3. (B) Schematic diagram of the screen process. Cells of cell line 5637 (hereafter, if the cell line is not specified, it is 5637 by default) that stably express Cas9 were transduced with lentiviral sgRNA libraries. These cells were then selected with Stx1 or Stx2 at 50 ng/mL for 48 h. The surviving cells were recovered in toxin-free medium and then subjected to the second round (R2) of selection with 1 μg/mL Stx1 or Stx2. The remaining cells were harvested and sgRNA sequences identified by NGS. Cells that were not exposed to toxins (Stx_R0) served as controls. (C-E) Genes identified in the screens with Stx1, Stx2, or ricin are ranked based on the number of unique sgRNAs (y axis) and total number of NGS reads (x axis). Top hits that overlap between Stx1 and Stx2 are marked in green. The two hits that appear across Stx1, Stx2, and ricin screens are marked in blue. The ricin-specific hits involved in receptor synthesis, membrane trafficking, and unknown functions are marked in red, orange, and brown, respectively. (F) The top hits marked in C–E were grouped by their subcellular localizations and the cellular pathways in which they might be involved. The asterisks mark novel hits identified in this study.

