Fig. 2.

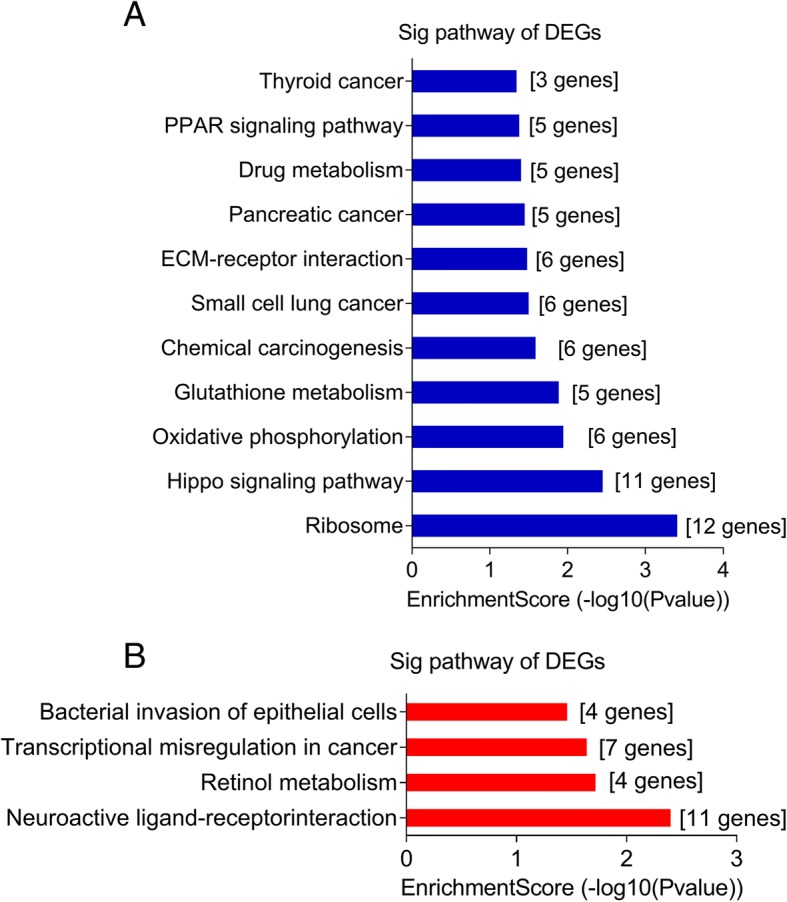
KEGG pathway analyses of differentially expressed genes (DEGs). a For upregulated DEGs (the top 11 enriched pathways are presented); and b for downregulated DEGs (the top 4 enriched pathways are presented)

KEGG pathway analyses of differentially expressed genes (DEGs). a For upregulated DEGs (the top 11 enriched pathways are presented); and b for downregulated DEGs (the top 4 enriched pathways are presented)