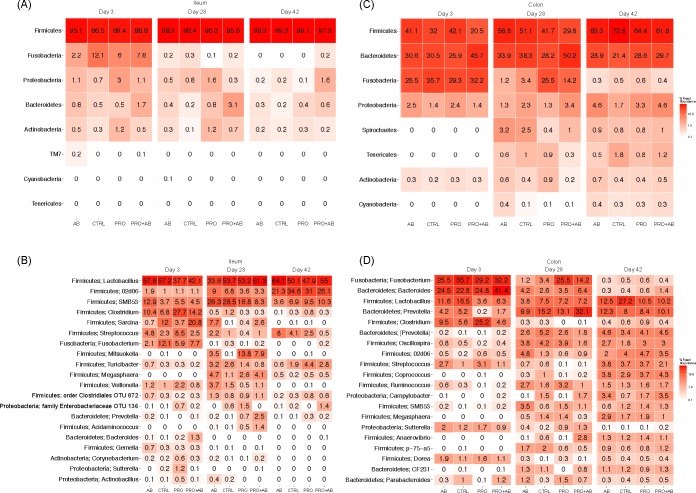
Fig 4. Heatmaps showing bacterial phyla and genera; digesta samples.
Heatmaps of ileal and colonic digesta samples collected at 3, 28, and 42 days of age from piglets administered gentamicin (AB; n = 33), Bacillus spores (PRO; n = 33), both gentamicin and Bacillus spores (PRO+AB; n = 31), and control piglets receiving neither gentamicin nor Bacillus spores (CTRL; n = 29). Heatmaps show the relative abundances (%) of (A) the eight most abundant phyla in ileal digesta, (B) the 20 most abundant genera in ileal digesta, (C) the eight most abundant phyla in colonic digesta, and (D) the 20 most abundant genera in colonic digesta. Colours represent the relative abundances on a logarithmic scale.

