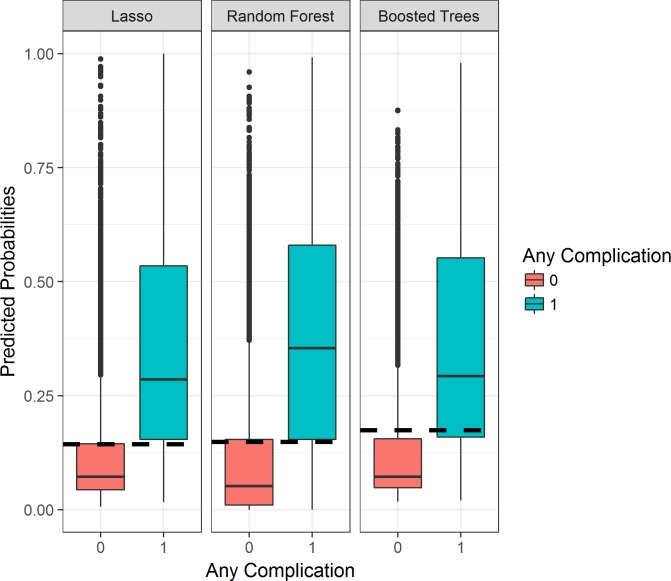
Fig 3. Boxplots displaying the model predicted probabilities for patients who experienced a postoperative complication versus those who did not.
Any postoperative complication (category = 1) versus no complications (category = 0). Thresholds (dashed lines) were chosen based on these population delineations. lasso, least absolute shrinkage and selection operator.

