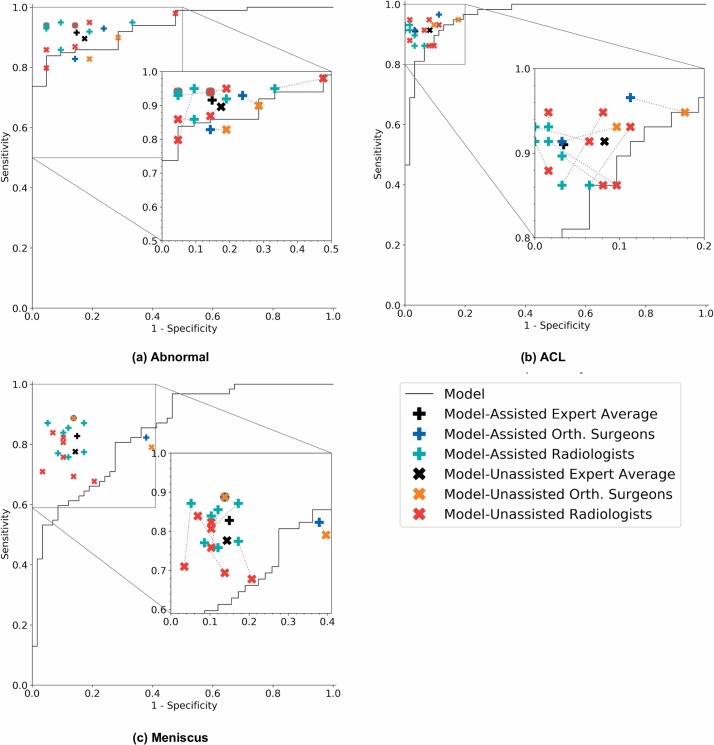
Fig 5. Receiver operating characteristic curves of the model and operating points of unassisted and assisted clinical experts.
Each plot illustrates the receiver operating characteristic (ROC) curve of the algorithm (black curve) on the validation set for (a) abnormality, (b) anterior cruciate ligament (ACL) tear, and (c) meniscus tear. The ROC curve is generated by varying the discrimination threshold (used to convert the output probabilities to binary predictions). Individual clinical expert (specificity, sensitivity) points are also plotted, where the red x’s represent model-unassisted general radiologists, the orange x’s represent model-unassisted orthopedic surgeons, the green plus signs represent model-assisted general radiologists, and the blue plus signs represent model-assisted orthopedic surgeons. We also plot the macro-average of the model-unassisted clinical experts (black x’s) and the macro-average of the model-assisted clinical experts (black plus signs). Each unassisted clinical expert operating point is connected to its corresponding model-assisted operating point with a dashed line.

