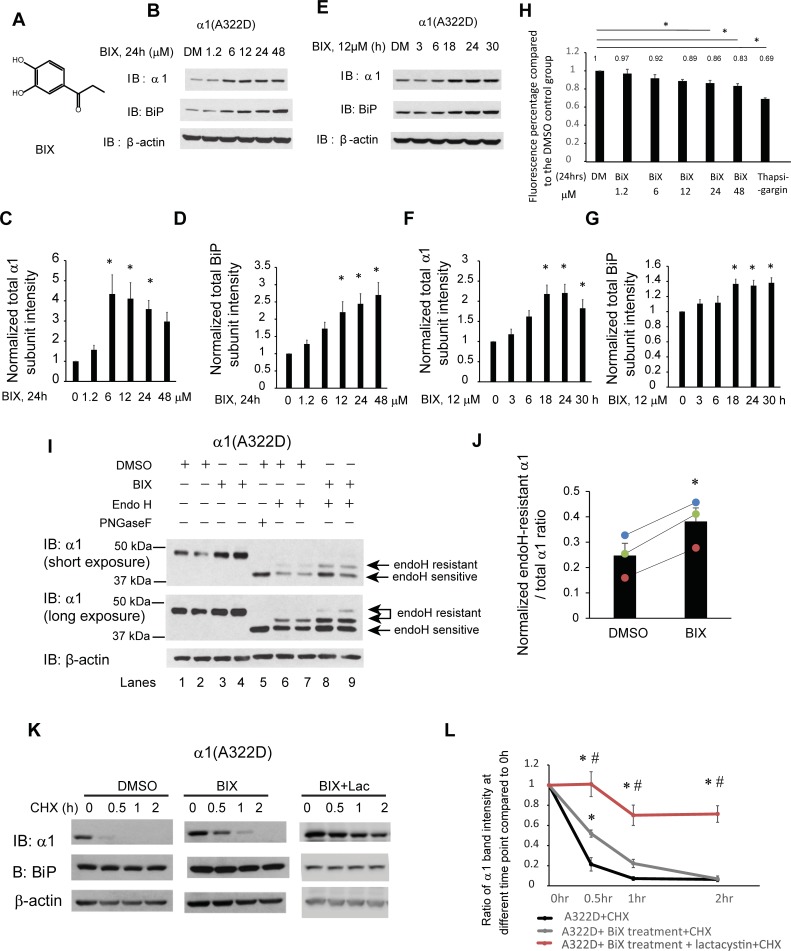
Fig 2. BIX, a potent BiP inducer, enhances the folding and trafficking and reduces the degradation of α1(A322D) subunits.
(A) Chemical structure of BIX. (B-D) Dose response of BIX treatment in regulating α1(A322D) total protein level. HEK293T cells stably expressing α1(A322D)β2γ2 GABAA receptors were treated with BIX at the indicated concentrations or the vehicle control DMSO in the cell culture media for 24 h. Cells were then lysed and subjected to SDS-PAGE and Western blot analysis (B). Normalized band intensities for α1(A322D) subunits and BiP are shown in (C) and (D) (n = 8). (E-G) Time course of BIX treatment in regulating α1(A322D) total protein level. HEK293T cells stably expressing α1(A322D)β2γ2 GABAA receptors were treated with BIX (12 μM) for the indicated time. Cells were then lysed and subjected to SDS-PAGE and Western blot analysis (E). Normalized band intensities for α1(A322D) subunits and BiP are shown in (F) and (G) (n = 5). (H) HEK293T cells stably expressing α1(A322D)β2γ2 GABAA receptors were plated into a 96-well plate on day 1. Cells were then treated with BIX at the indicated concentrations or the vehicle control DMSO in the cell culture media for 24 h. One groups of HEK293T cells stably expressing α1(A322D)β2γ2 GABAA receptors are treated with thapsigargin (2 μM, 7h) as cell toxicity positive control. Resazurin (0.15mg/ml dissolved in DPBS) is added to cells 1.5 h before plate reading. Fluorescence signal at 560 nm excitation / 590 nm emission is measured. The ratios of fluorescence signal in the DMSO treatment group to treatment groups is shown in (H) (n = 4, one-way ANOVA). (I) HEK293T cells expressing α1(A322D)β2γ2 receptors were treated with BIX (12 μM, 24 h) or DMSO vehicle control. Then cells were lysed, and total proteins were extracted. Total cellular proteins were incubated with or without endoglycosidase H enzyme (endo H) or peptide-N-glycosidase F (PNGase F) for 1h at 37°C and then subjected to SDS-PAGE and Western blot analysis. Endo H resistant α1 subunit bands (top arrows, lanes 6–9) represent properly folded, post-ER α1 subunit glycoforms that traffic at least to the Golgi compartment, whereas endo H sensitive α1 subunit bands (bottom arrow, lanes 6–9) represent immature α1 subunit glycoforms that are retained in the ER. The PNGase F enzyme cleaves between the innermost N-acetyl-D-glucosamine and asparagine residues from N-linked glycoproteins, serving as a control for unglycosylated α1 subunits (lane 5). The ratio of endo H resistant α1 / total α1, which was calculated from endo H-resistant band intensity / (endo H-resistant + endo H-sensitive band intensity), serves as a measure of trafficking efficiency of the α1(A322D) subunit. Quantification of this ratio after endo H treatment (lanes 6–9) is shown in (J) (n = 3, paired t-test). (K) HEK293T cells stably expressing α1(A322D)β2γ2 receptors were either treated with DMSO vehicle control, or BIX (12 μM, 24 h) or BIX (12 μM, 24 h) and lactacystin (2.5μM, 24h). Cycloheximide (150 μg/ml), a protein synthesis inhibitor, was added to different cell groups for 0, 0.5 hr, 1 hr, and 2 hrs. Cells were then lysed and subjected to SDS-PAGE and western blot analysis. The quantitation results are shown in (L) (n = 5, one-way ANOVA followed by Fisher test, *, p<0.05 between DMSO vehicle control and treatment groups, #, p<0.05 between BIX group and BIX + Lac group). Statistical significance was evaluated using one-way ANOVA followed by post-hoc Tukey test in (C), (D), (F), and (G). *, p<0.05. Error bar = SEM.

