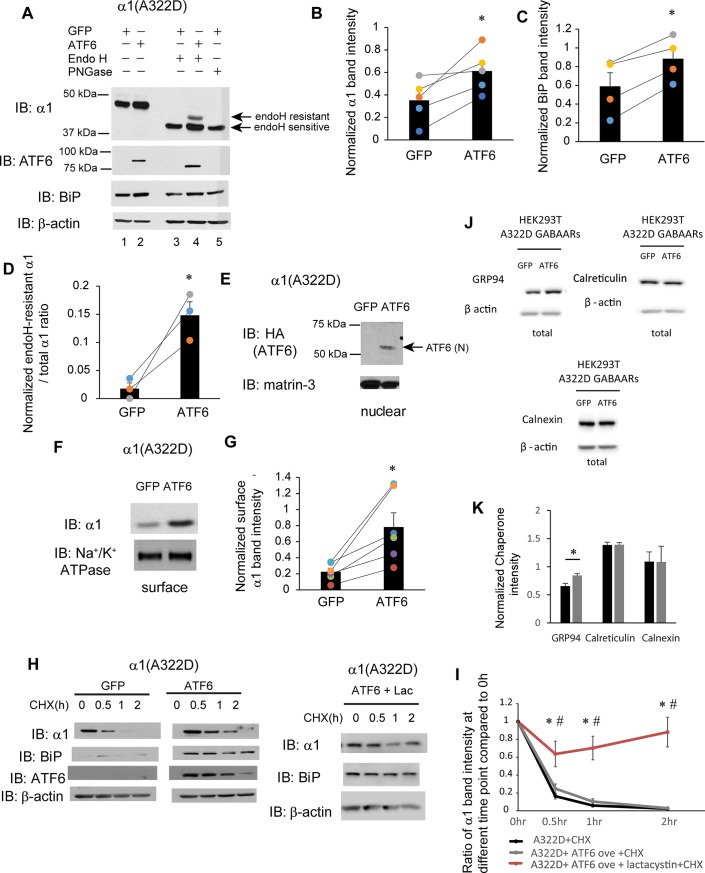
Fig 5. ATF6 activation promotes the forward trafficking of α1(A322D) subunit of GABAA receptors.
(A) HEK293T cells expressing α1(A322D)β2γ2 receptors were transiently transfected with GFP or HA-tagged full-length ATF6α plasmids. Forty-eight hrs post transfection, cells were lysed, and total proteins were extracted. Total cellular proteins were incubated with or without endoglycosidase H enzyme (endo H) or peptide-N-glycosidase F (PNGase F) for 1h at 37°C and then subjected to SDS-PAGE and Western blot analysis using corresponding antibodies. Endo H resistant v1 subunit bands (top arrow, lane 4) represent properly folded, post-ER α1 subunit glycoforms that traffic at least to the Golgi compartment, whereas endo H sensitive α1 subunit bands (bottom arrow, lanes 3 and 4) represent immature α1 subunit glycoforms that are retained in the ER. The PNGase F enzyme cleaves between the innermost N-acetyl-D-glucosamine and asparagine residues from N-linked glycoproteins, serving as a control for unglycosylated α1 subunits (lane 5). Quantification of total cellular protein expression levels of α1 and BiP is shown in (B) and (C) (n = 5 for α1 and n = 4 for BiP, paired t-test). Quantification of the ratio of endo H resistant α1 / total α1 is shown in (D) (n = 3, paired t-test). (E) Cells were treated as in (A). Forty-eight hrs post transfection, the nuclear fractions were extracted and subject to SDS-PAGE. ATF6 (N) is the cleaved, activated N-terminal ATF6 in the nucleus. Matrin-3 serves as a nuclear protein loading control. (F) HEK293T cells were treated as in (A). Forty-eight hrs post transfection, the cell surface proteins were tagged with biotin using membrane-impermeable biotinylation reagent sulfo-NHS SS-Biotin. Biotinylated surface proteins were affinity-purified using neutravidin-conjugated beads and then subjected to SDS-PAGE and Western blot analysis. The Na+/K+-ATPase serves as a surface protein loading control. Quantification of normalized surface α1(A322D) protein levels is shown in (G) (n = 6, paired t-test). (H) HEK293T cells expressing α1(A322D)β2γ2 receptors were either transfected with GFP control, or ATF6, or transfected with ATF6 and treated with lactacystin (2.5μM for 24h). Cycloheximide (150 μg/ml), a protein synthesis inhibitor, was added to different cell groups for 0, 0.5 hr, 1 hr, and 2 hrs. Cells were then lysed and subjected to SDS-PAGE and western blot analysis. The quantitation results are shown in (I) (n = 5, one-way ANOVA followed by Fisher test, *, p<0.05 between GFP control and ATF6 + Lac group, #, p<0.05 between ATF6 group and ATF6 + Lac group). (J and K) HEK293T cells expressing α1(A322D)β2γ2 receptors were either transfected with GFP or ATF6 for 48h. The cell lysates were then subjected to SDS-PAGE and Western blot analysis using corresponding antibodies (J). Quantification of total cellular chaperone protein expression levels is shown in (K) (n = 4, paired t-test). *, p<0.05.

