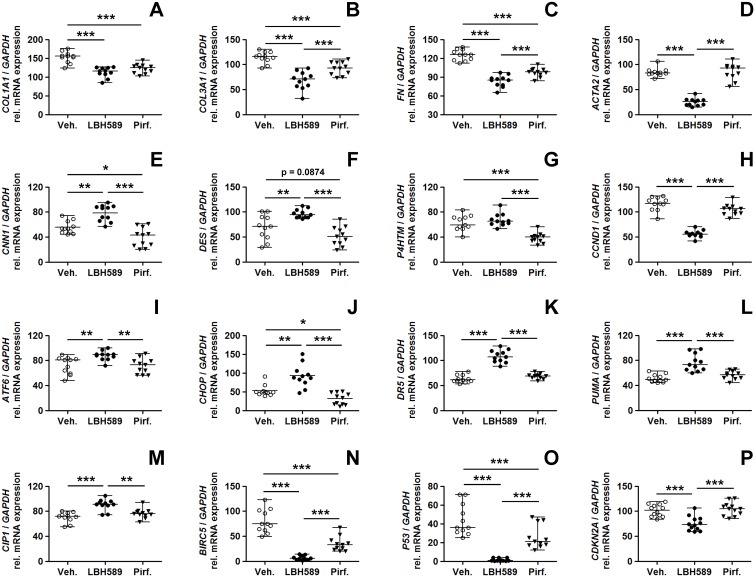
Fig 3. Cellular consequences in primary IPF-fibroblasts in response to treatment with panobinostat or pirfenidone.
Primary IPF-fibroblasts (n = 5,6) were incubated for 24h with vehicle [Veh., 0.25% (v/v) DMSO], panobinostat (LBH589, 85 nM) or pirfenidone (Pirf., 2.7 mM). The effects of vehicle-, LBH589- and pirfenidone-treatment were analyzed by reverse transcription-polymerase chain reaction (RT-PCR) for indicated genes. (A) COL1A1, (B) COL3A1, (C) FN, (D) ACTA2, (E) CNN1, (F) DES, (G) P4HTM, (H) CCND1, (I) ATF6, (J) CHOP, (K) DR5, (L) PUMA, (M) CIP1, (N) BIRC5, (O) P53 and (P) CDKN2A. Each PCR reaction was performed with 100 ng reverse-transcribed complementary DNA, followed by electrophoresis through a 2% (w/v) agarose gel containing ethidium bromide. Scanned agarose gels of indicated genes are shown in S1 Fig. Band intensities of PCR products were densitometrically quantified, and mRNA expression of indicated genes was normalized to the expression of GAPDH. Data are presented as median ± range of the individual values, from two independent experiments. *p<0.05, **p<0.01, ***p<0.001, by Mann Whitney test.

