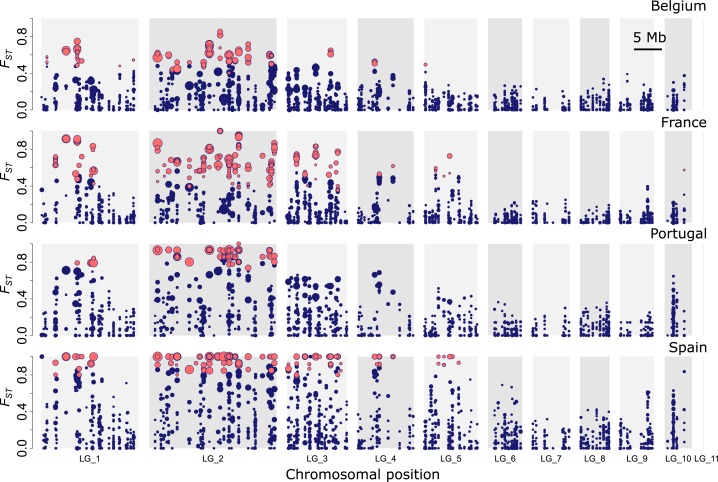
Fig 5. Genomic divergence (FST) between Pogonus chalceus ecotype pairs.
Outlier SNPs within each population pair, as identified by BayeScan [34], are indicated in red. Size of points is proportional to the log10BF reported by BayEnv2 [35] and indicates the degree of support that allele frequencies are significantly correlated with habitat type across all sampled populations. Markers on LG10 are significantly sex-linked. Average FST values across SNPs between all population comparisons are reported in S1 Table and the distribution of FST values is given in S3 Fig.

