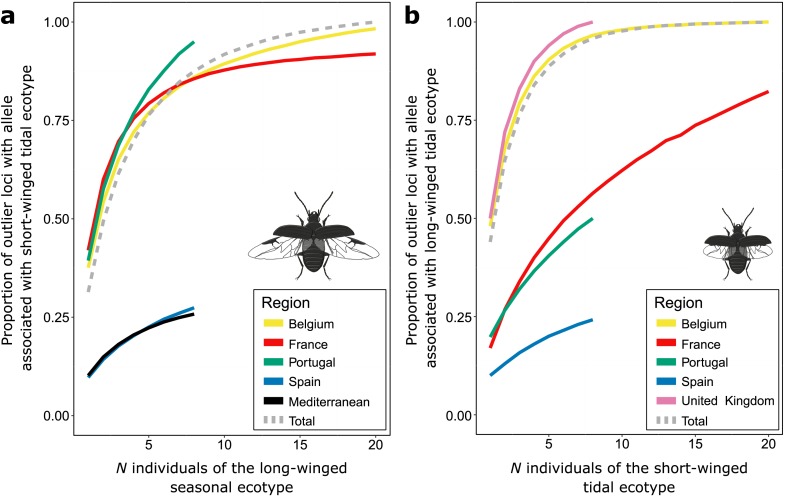
Fig 7. Quantifying standing genetic variation.
Accumulation curves of (a.) the proportion of outlier loci containing at least one copy of the allele associated with the short-winged tidal ecotype in a random sample of N individuals of the long-winged seasonal ecotype and (b.) the proportion of outlier loci containing at least one copy of the allele associated with the long-winged seasonal ecotype in a random sample of N individuals of the short-winged tidal ecotype. Proportions are averaged over 100 replicates of N individuals.

