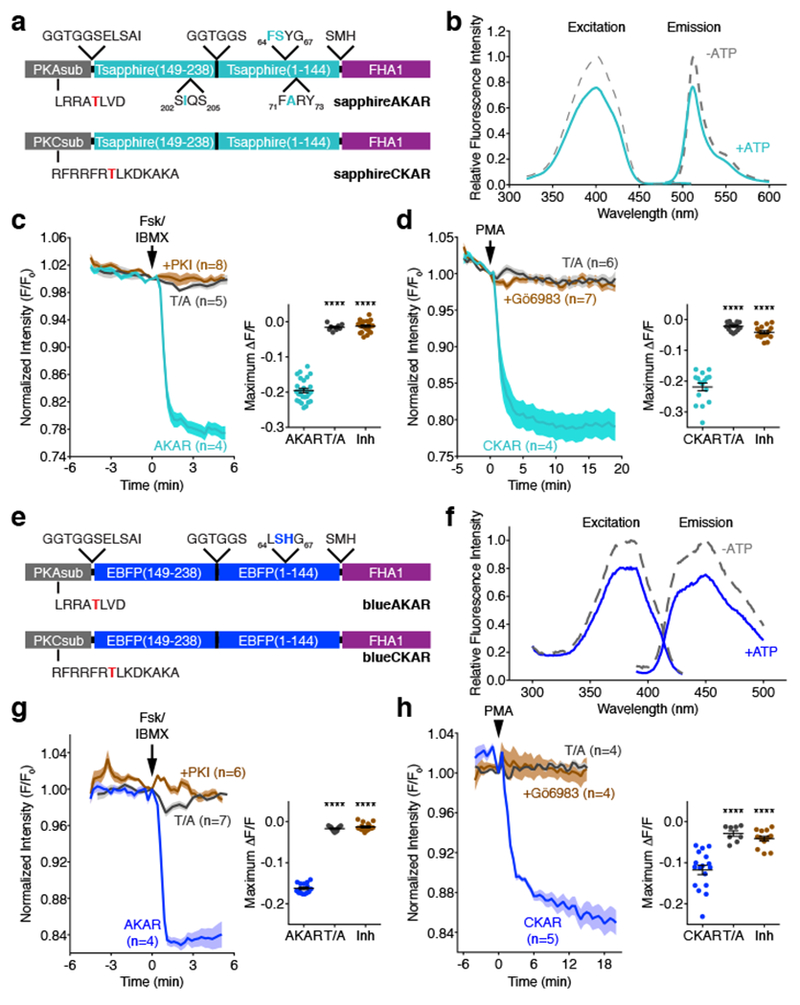
Figure 5. AKAR and CKAR color variants based on cp-T-sapphire and cpBFP.

(a, e) Domain structures of (a) sapphireAKAR and sapphireCKAR and (e) blueAKAR and blueCKAR. (b, f) Representative fluorescence spectra of (b) sapphireAKAR and (f) blueAKAR collected in without (gray) and with (teal or blue) ATP in the presence of PKA catalytic subunit. n=3 independent experiments. (c) Average time-courses (left) and maximum responses (ΔF/F, right) in Fsk/IBMX-treated HeLa cells. n=27 (sapphireAKAR), 8 (sapphireAKAR[T/A]), and 22 (sapphireAKAR plus PKI) cells. Curves are representative of and bar graphs are pooled from 6, 2, and 3 experiments. (****p<0.0001, F=386.4, DFn=2, DFd=54; one-way ANOVA followed by Dunnet’s multiple comparisons test). (d) Average time-courses (left) and maximum responses (ΔF/F, right) in PMA-treated HeLa cells. n=16 (sapphireCKAR), 15 (sapphireCKAR[T/A]), and 16 (sapphireCKAR with 10 μM Gö6983 pretreatment) cells. Curves are representative of and bar graphs are pooled from 5, 3, and 3 experiments. (****p<0.0001, F=176.5, DFn=2, DFd=44; one-way ANOVA followed by Dunnet’s multiple comparisons test). (g) Average time-courses (left) and maximum responses (ΔF/F, right) of blueAKAR (n=15 cells), blueAKAR(T/A) (n=11 cells), and blueAKAR plus PKI (n=16 cells) (****p<0.0001, F=1105, DFn=2, DFd=39; one-way ANOVA followed by Dunnet’s test). Curves are representative of and bar graphs are pooled from 5, 2, and 4 experiments. (f) Average time-courses (left) and maximum responses (ΔF/F, right) of blueCKAR (n=17 cells), blueCKAR(T/A) (n=8 cells), and blueCKAR with Gö6983 pretreatment (n=14 cells) (****p<0.0001, F=26.38, DFn=2, DFd=36; one-way ANOVA followed by Dunnet’s multiple comparisons test). Curves are representative of and bar graphs are pooled from 6, 2, and 3 experiments. Curves are normalized with respect to time 0 (F/F0). Solid lines represent the mean; shaded areas, SEM. For dot plots shown in c, d, g, and h, horizontal bars represent mean ± SEM. Maximum responses are calculated as ΔF/F=(Fmax-Fmin)/Fmin. See Supplementary Table 1 for bar graph source data.
